Cover Crops: Reducing Farm Runoff While Saving Soil

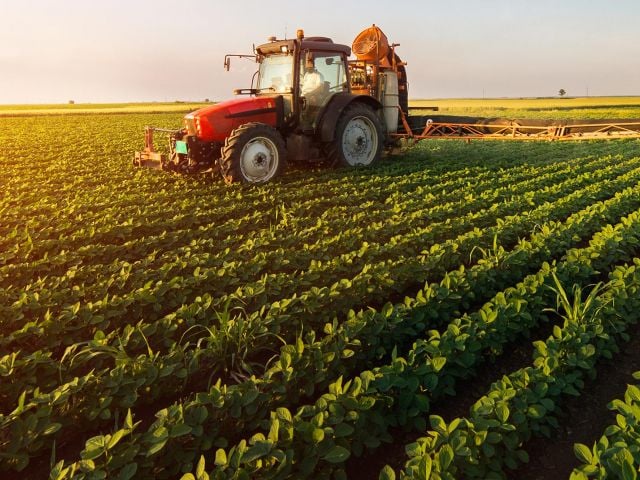
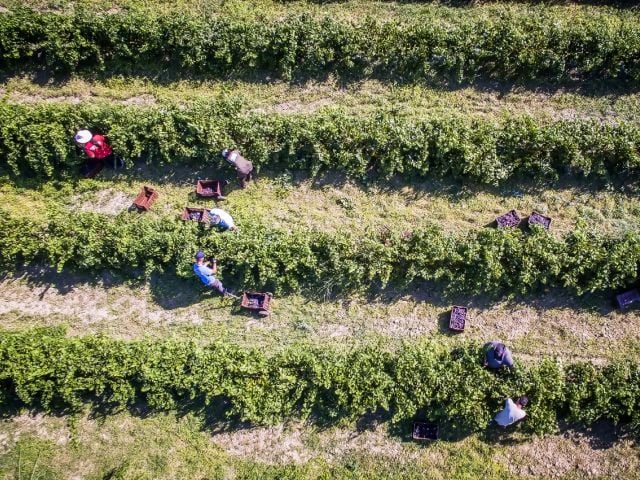
In the summer, millions of lush green acres of corn and soybeans blanket the Midwest. Come fall, many harvesters scrape crop fields until they are black and barren, exposing large swaths of vulnerable land to heavy rains, melting snow and powerful winds. Until the following year’s planting, soils laden with toxic farm chemicals are left to wash downstream, where they may contaminate sources of drinking water.

But there is a highly effective strategy that can both reduce polluted runoff and hold the soil in place: planting cover crops.

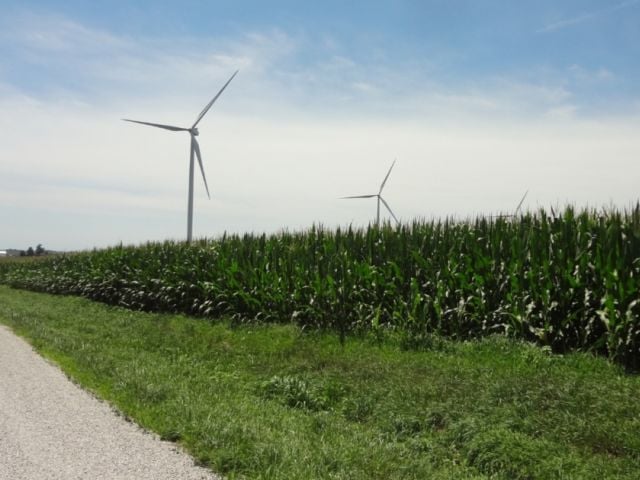
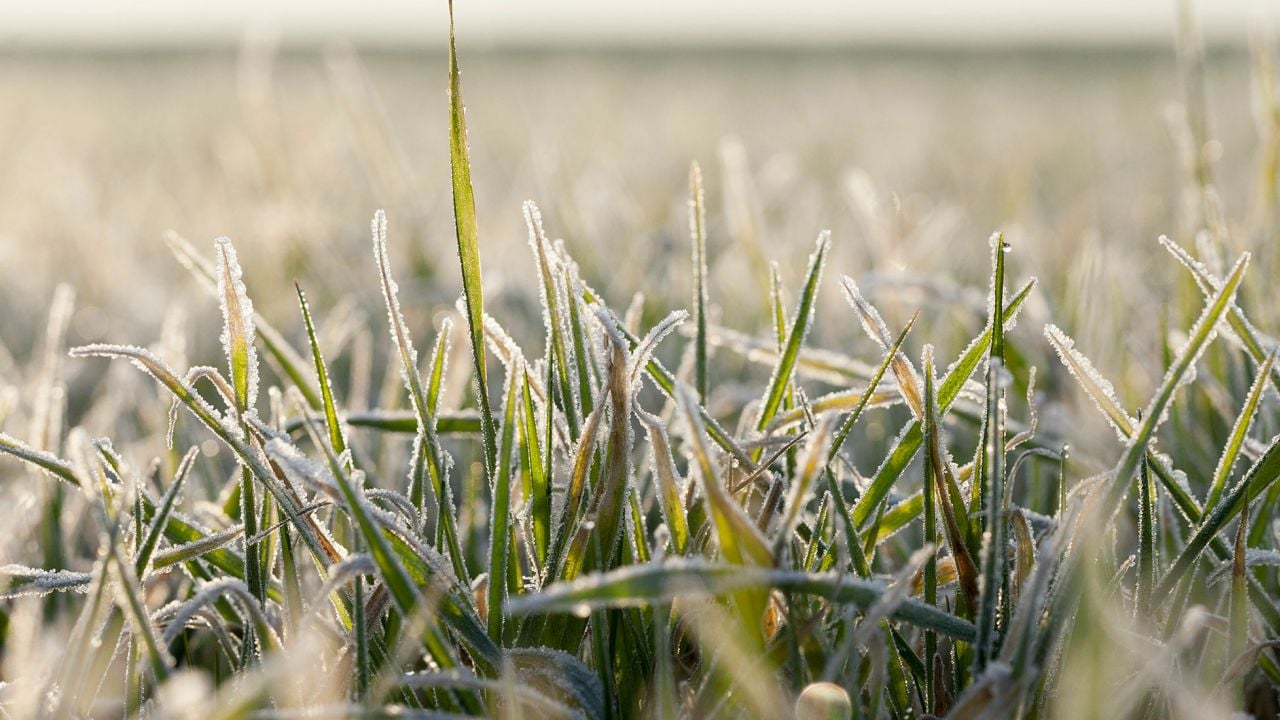
These are off-season crops, such as cold season grasses and legumes, that absorb nitrogen and phosphorus and preserve precious soil. Done right, cover crops make farming more sustainable in the face of flooding and drought, conditions that climate change is making more frequent, severe and volatile.

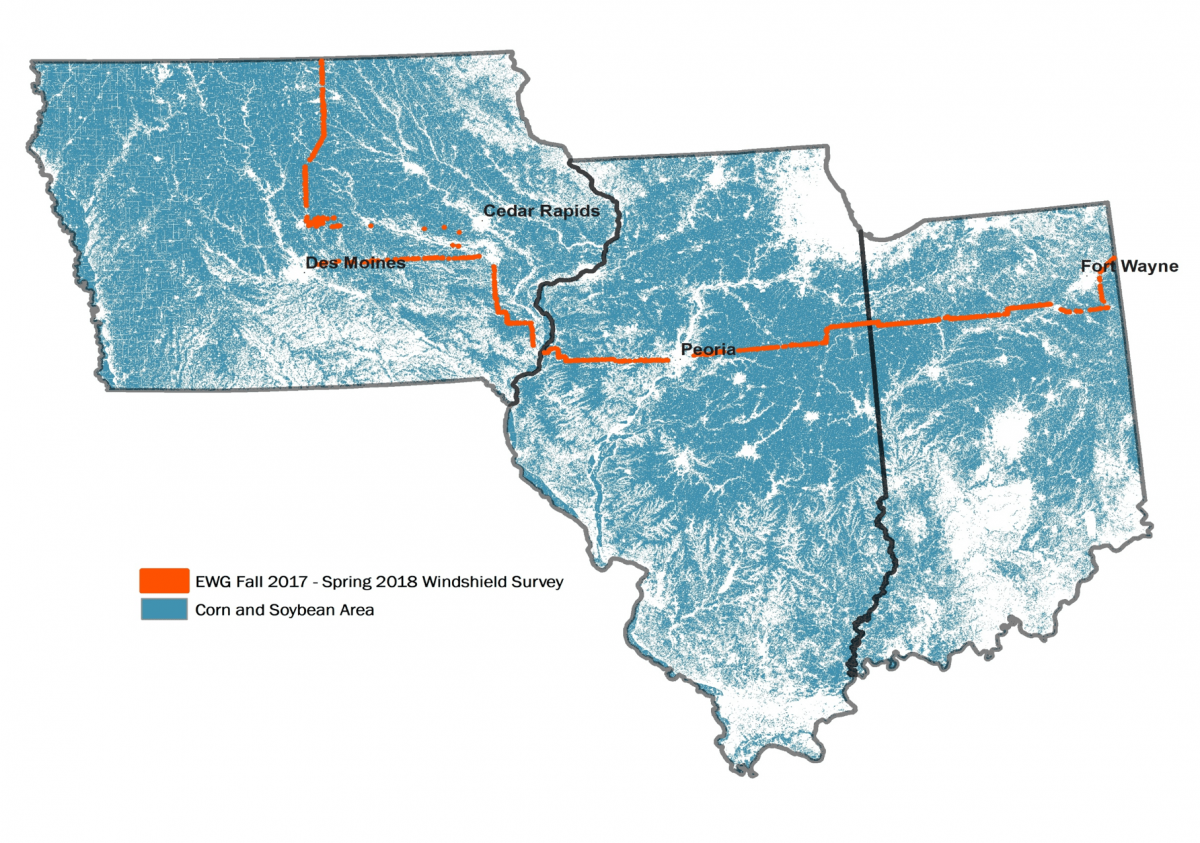
To see how widely this strategy is being adopted, EWG used satellite imagery to track the use of cover crops in three key farm states – Illinois, Indiana and Iowa. We tracked the growth of cover crops in the fall of 2015 and spring of 2016, and again during the fall of 2017 and spring of 2018. (The 2015-16 seasons were defined as the 2015 cover crop year, and the 2017-18 seasons as the 2017 cover crop year.) 

Cover crop acreage up, but still miniscule

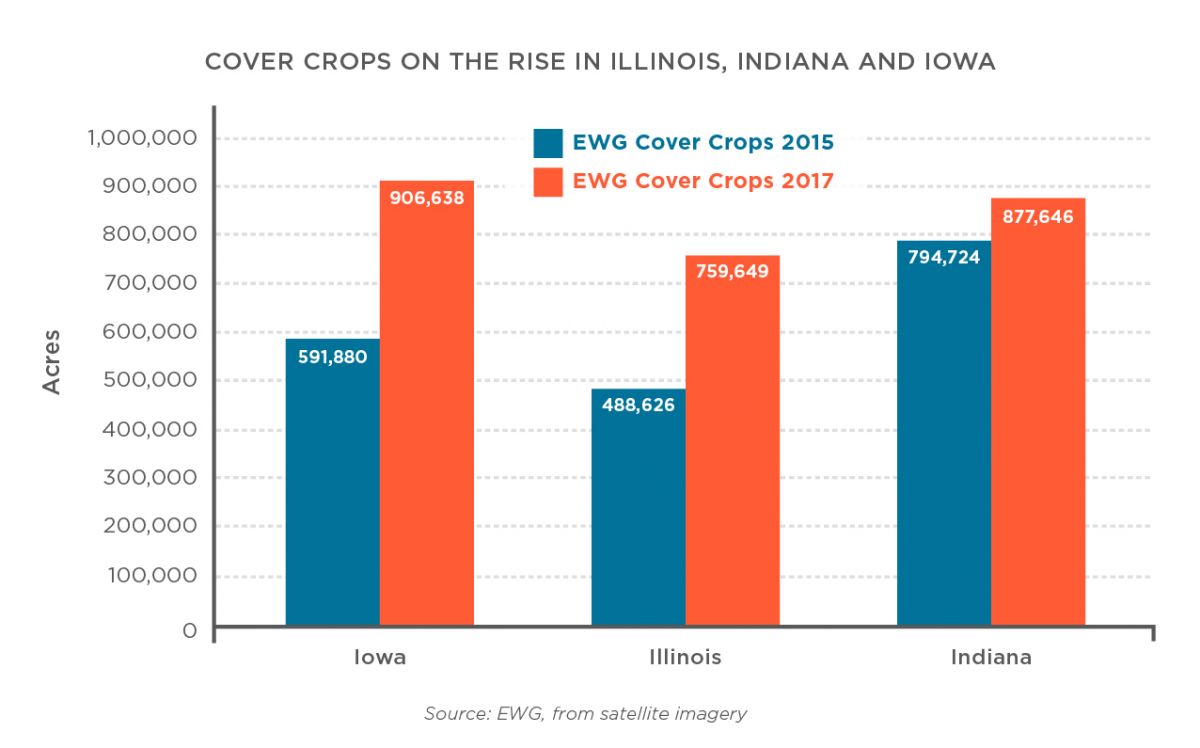
The good news: All three states saw a net increase in cover crop acres in those years. Satellite photos showed that from the 2015 cover crop year to the 2017 cover crop year:

  • In Illinois, cover crops increased from approximately 489,000 acres to 760,000 acres.
  • In Indiana, from 795,000 acres to 878,000 acres.
  • In Iowa, from 592,000 acres to 907,000 acres.

The not-so-good news: Even with the increase, acres protected by cover crops remain a tiny percentage of row crop acres in these three states. In Illinois only 3.6 percent of all corn and soybean acres were protected by cover crops, in Indiana 7.8 percent and in Iowa 3.9 percent. 

Cover crop acreage increased in 88 percent of Illinois counties (90 of 102 counties), 68 percent of Indiana counties (63 of 92) and three-fourths of Iowa counties (74 of 99). The average gain was more than 3,100 acres per county in Illinois, more than 2,400 acres per county in Indiana and more than 5,100 acres per county in Iowa.

Some regions, such as western Iowa and southern Illinois, saw above-average growth of cover crop acreage compared to the entire state, whereas in Indiana, growth was more evenly distributed. But other areas saw a drop in acreage. In 12 Illinois counties, the average loss was about 1,200 acres; in Indiana, 29 counties had an average loss of 2,300 acres; and in Iowa, 25 counties had an average loss of 2,700 acres. 

Counties that lost or gained cover crop acres between 2015 and 2017

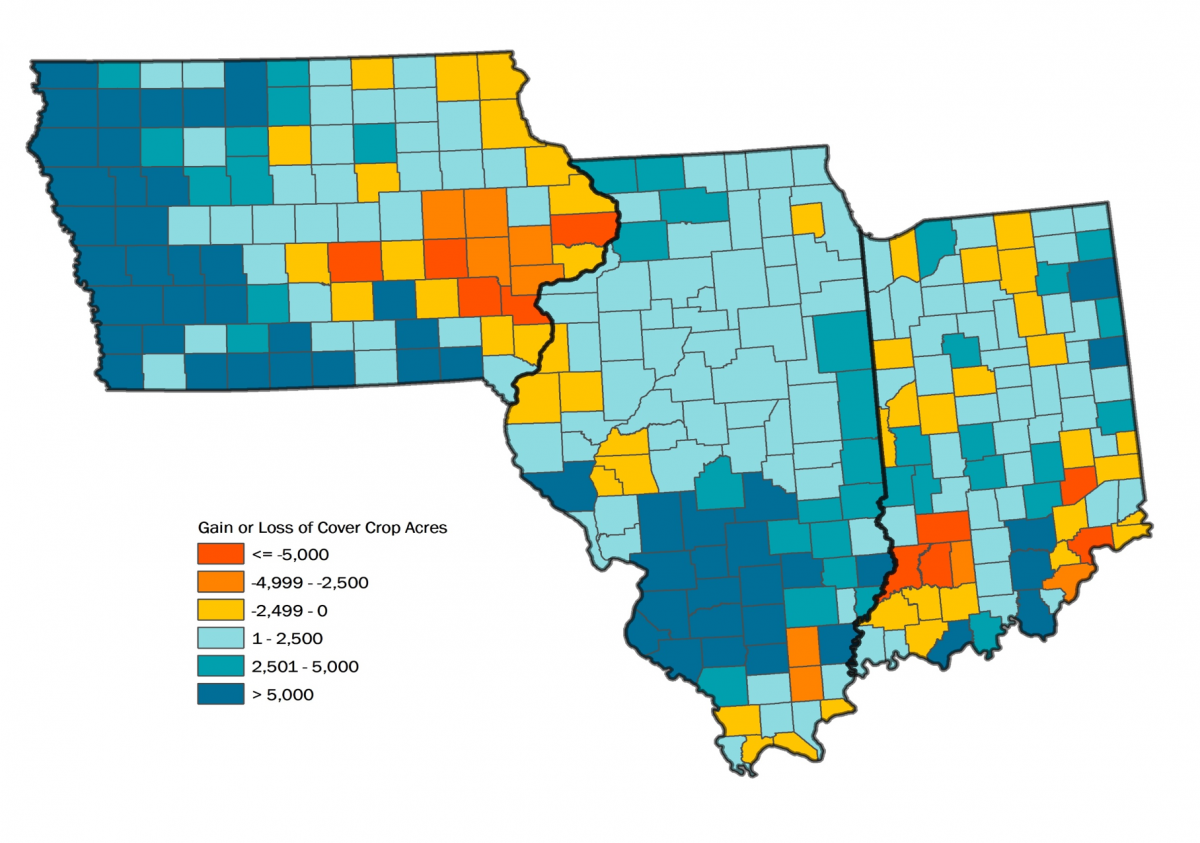
Source: EWG, from satellite imagery

Comparing EWG’s findings with other research

A report from Iowa Learning Farms projected 880,000 cover crop acres in Iowa in 2018, close to what EWG found for the 2017 cover crop year. This total is up 120,000 acres from the group’s report of 760,000 in 2017. The Indiana State Department of Agriculture reported that in 2017 there were 935,000 acres of cover crops planted atop corn and soybeans. EWG detected 878,000 acres in Indiana during the 2017 cover crop year. We were unable to find relevant data for total cover crop acres in Illinois.

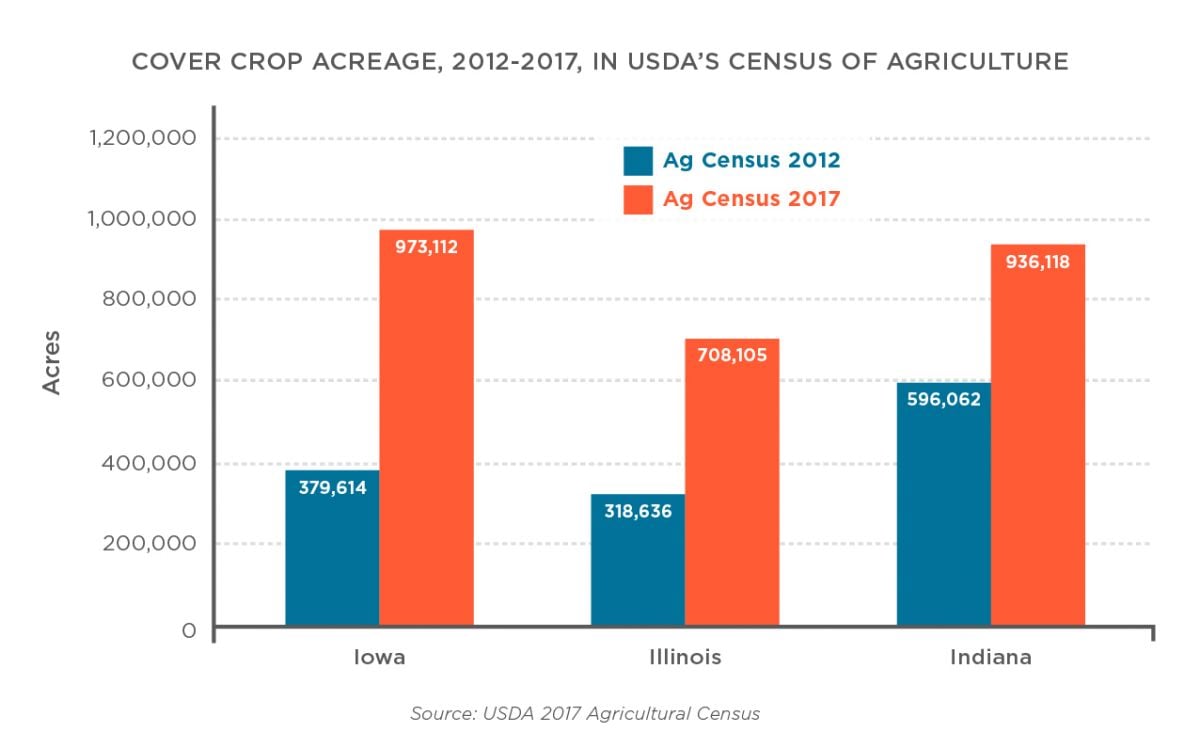
EWG’s findings align closely with the figures reported in the federal Department of Agriculture’s 2017 Census of Agriculture. The census recorded just over 973,000 cover crop acres in Iowa in 2017, compared to EWG’s estimate of 906,000 acres in the 2017 cover crop year. In Illinois, USDA reported more than 708,000 cover crop acres, slightly less than EWG’s estimate of 759,000 acres. According to the census, Indiana had 936,000 acres of cover crops, more than the 877,000 acres EWG found.


Conclusion

Although Iowa, Illinois and Indiana have made substantial progress in cover crop acreage in only two years, it is still miniscule compared to the effort needed to measurably slow soil erosion and protect water from agriculture pollutants. The Iowa Nutrient Reduction Strategy recommends that 12.6 million acres, or around half the state’s corn and soybean acres, be planted with cover crops. Our finding of 907,000 acres of cover crops in Iowa falls woefully short of that goal. In Indiana, 4.7 million additional acres of cover crops are needed to protect half of the corn and soybean acres in that state. In Illinois, an additional 9.8 million acres of cover crops are needed to protect half the corn and soybean acres.

We’re in this together

Donate today and join the fight to protect our environmental health.

Methodology

Special thanks to EWG staff members Audrey Lothspeich, GIS Analyst, and Sarah Porter, Senior GIS Analyst, and Sarah Carlson of Practical Farmers of Iowa, who all made critically important contributions to this project.

METHODS AND ANALYSIS

To capture yearly cover crop emergence, EWG used the fall and spring to account for one cover crop year. Typically, fall cover crops go dormant during cold temperatures and snow cover and reemerge the following spring, and some cover crops are planted only in the spring. This is why we categorize both spring and fall cover crop detections as one “cover crop year.”

In November 2017 and April 2018, EWG collected agricultural cover type data for more than 700 fields in the three states via a visual survey. (Figure 1.). Analysts from EWG drove around central Iowa in the fall of 2017 and from Fort Wayne, Indiana, to the north central border of Iowa and Minnesota in the spring of 2018. Throughout both trips, analysts collected field locations and various cover type characteristics associated with the site.

EWG visual survey, collecting 740 field locations during Fall 2017 and Spring of 2018.

Source: EWG

These data were paramount for spatially differentiating between various cover types using the Normalized Difference Vegetation Index, or NDVI, to create field mean values throughout the fall and spring. The satellite sensor data used to create the NDVI surfaces were taken from Landsat8 (30 meter resolution) and Sentinel2 (10 meter resolution). To make the two datasets more comparable, the Sentinel2 data (RED and NIR bands) were calibrated to Landsat8 data using overlapping imagery from the same day. All Sentinel2 detections were also rescaled to match Landsat8’s and the USDA Cropland Data Layer’s 30 meter resolution. In total, EWG assessed more than 110 Landsat8 scenes and 373 Sentinel2 for the fall and spring.

The satellite-derived NDVI thresholds for individual fall and spring imagery were used to develop a temporal signature for the cover crops and other various cover types, like tillage and no-till. The signature was then used to detect some cover crops within the three-state region.

Monthly NDVI averages from field mean samples of known cover types in Iowa, Indiana and Illinois

Source: EWG

After satellite pixels were identified as cover crops from individual scenes, all overlapping scenes were patched together andfiltered to extract only contiguous areas of 10 acres or more. The 2008 Farm Service Agency’s geospatial Common Land Unit data, a high-resolution digitization of field boundaries, were then used to reduce for edge of field pixels and fill areas of spotty emergence. Those same features were then screened to remove elongated and linear shapes indicative of fence rows and grass waterways with metrics resulting from the feature’s area and perimeter. The resulting features were finally separated to show only areas where cover crops were planted atop corn or soybeans using the CDL. The results were then summarized by county and HUC12 watershed.

Validation

Ground control collected in the fall had a higher precision than samples collected in the spring (80 percent vs. 60 percent). In an effort to test the alignment of the NDVI signature, EWG crossed our visual survey results with the final outputs and found 15 false positives out of the 740 total samples. Thirteen of the 15 false positives were documented as winter wheat, a cash crop that is often used as a cover crop and that maintains an NDVI signature similar to cover crops. This makes it almost impossible to discriminate between the two cover types. Data from the 2018 CDL show that double crop and standalone winter wheat make up 2 percent of all Illinois total cropland, 1.9 percent of Indiana total cropland and an insignificant amount in Iowa.

References

Seifert, Christopher A., George Azzari and David B Lobell. Satellite detection of cover crops and their effects on crop yield in the Midwestern United States. Environmental Research Letters, 2018 Vol. 13 No. 6.

Soren Rundquist and Sarah Carlson. Mapping Cover Crops on Corn and Soybeans in Illinois, Indiana and Iowa, 2015–6. Washington D.C. www.ewg.org Accessed March 2019. https://static.ewg.org/reports/2017/mapping_cover_crops/EWG_CoverCropReport_C07.pdf.

W.D. Hively et al. Remote Sensing to Monitor Cover Crop Adoption in Southeastern Pennsylvania. Journal of Soil and Water Conservation, 2015; 64:340-352.

W.D. Hively et al. Using Satellite Remote Sensing to Estimate Winter Cover Crop Nutrient Uptake Efficiency. Journal of Soil and Water Conservation, 2009; 64:303-313.

Kusuma W. Prabhakara et al. Evaluating the Relationship between Biomass, Percent Groundcover and Remote Sensing Indices across Six Winter Cover Crop Fields in Maryland, United States. International Journal of Applied Earth Observation and Geoinformation, 2015; 39:88–102.

Iowa Learning Farms. Building a Culture of Conservation. Ames, IA. www.iowalearningfarms.org, 2018. Accessed March 2019. https://www.iowalearningfarms.org/files/page/files/ilf-15yr-report-final-web_reduced.pdf.

Indiana State Department of Agriculture. Indiana Cover Crops: 2011-2017. Indianapolis, IN. www.in.gov, 2017. Accessed March 2019. https://www.in.gov/isda/files/Cover%20Crop%20Trends%202011-2017%20Statewide.pdf.

Iowa Department of Agriculture and Land Stewardship et al., Iowa Nutrient Reduction Strategy: A Science and Technology-Based Framework to Assess and Reduce Nutrients to Iowa Waters and the Gulf of Mexico. 2016. Available at http://www.nutrientstrategy.iastate.edu/sites/default/files/documents/INRSfull-161001.pdf.

USDA NASS, 2017 Census of Agriculture, Ag Census Web Maps. Available at: www.nass.usda.gov/Publications/AgCensus/2012/Online_Resources/Ag_Census_Web_Maps/Overview/.

Topics
Learn about these issues