Zoom in and click on counties/markers to interact with the map.

Sign up to receive email updates, action alerts, health tips, promotions to support our work and more from EWG and EWG Action Fund. You can opt-out at any time.

Share this page

Share Share

Share Share on Social Media

Map Info

Report: Elementary School Students At Increased Pesticide Risk

On the map, click on counties/markers for more information.

County Map District Map

Notes:

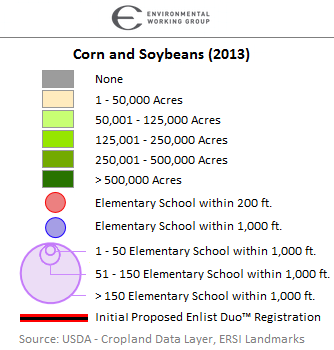
The large purple circles represent state totals for schools within 1,000 ft. of corn and soybean fields. Zoom in and click on a district or elementary school point to see specific data about potential exposure to 2,4-D, within 1,000 ft./200 ft. of corn and soybean production.