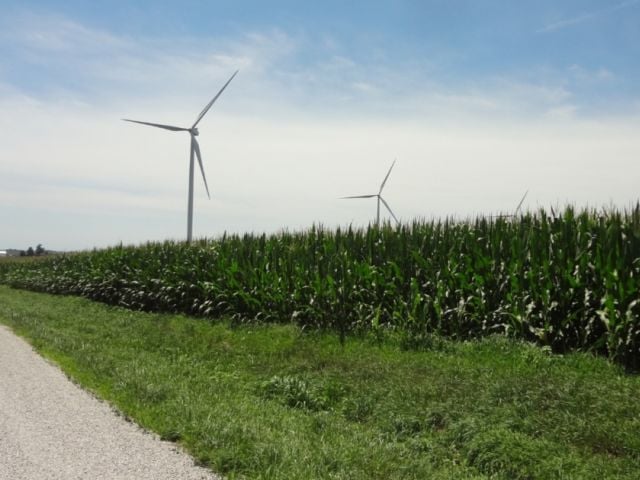
 The Raccoon River in central Iowa runs through one of the most intensely farmed regions of the nation. Agriculture is vital to the area’s economy, but polluted runoff from farms poses an acute threat to residents’ tap water – and a daunting challenge to utilities struggling to keep the water clean.
Almost three-fourths of the Raccoon River’s watershed – 1.7 million acres – is planted with corn, soybeans and other crops, treated each year with millions of pounds of fertilizer and other chemicals[1] It is also home to 2.3 million hogs and 16 million chickens and turkeys,[2] whose manure is applied to millions of acres annually.[3] At the southern tip of the watershed is the city of Des Moines, where each day the Des Moines Water Works supplies water drawn from the river to just over half a million people.
Figure 1: The 3,625-square-mile Raccoon River watershed drains 1.7 million acres of cropland.
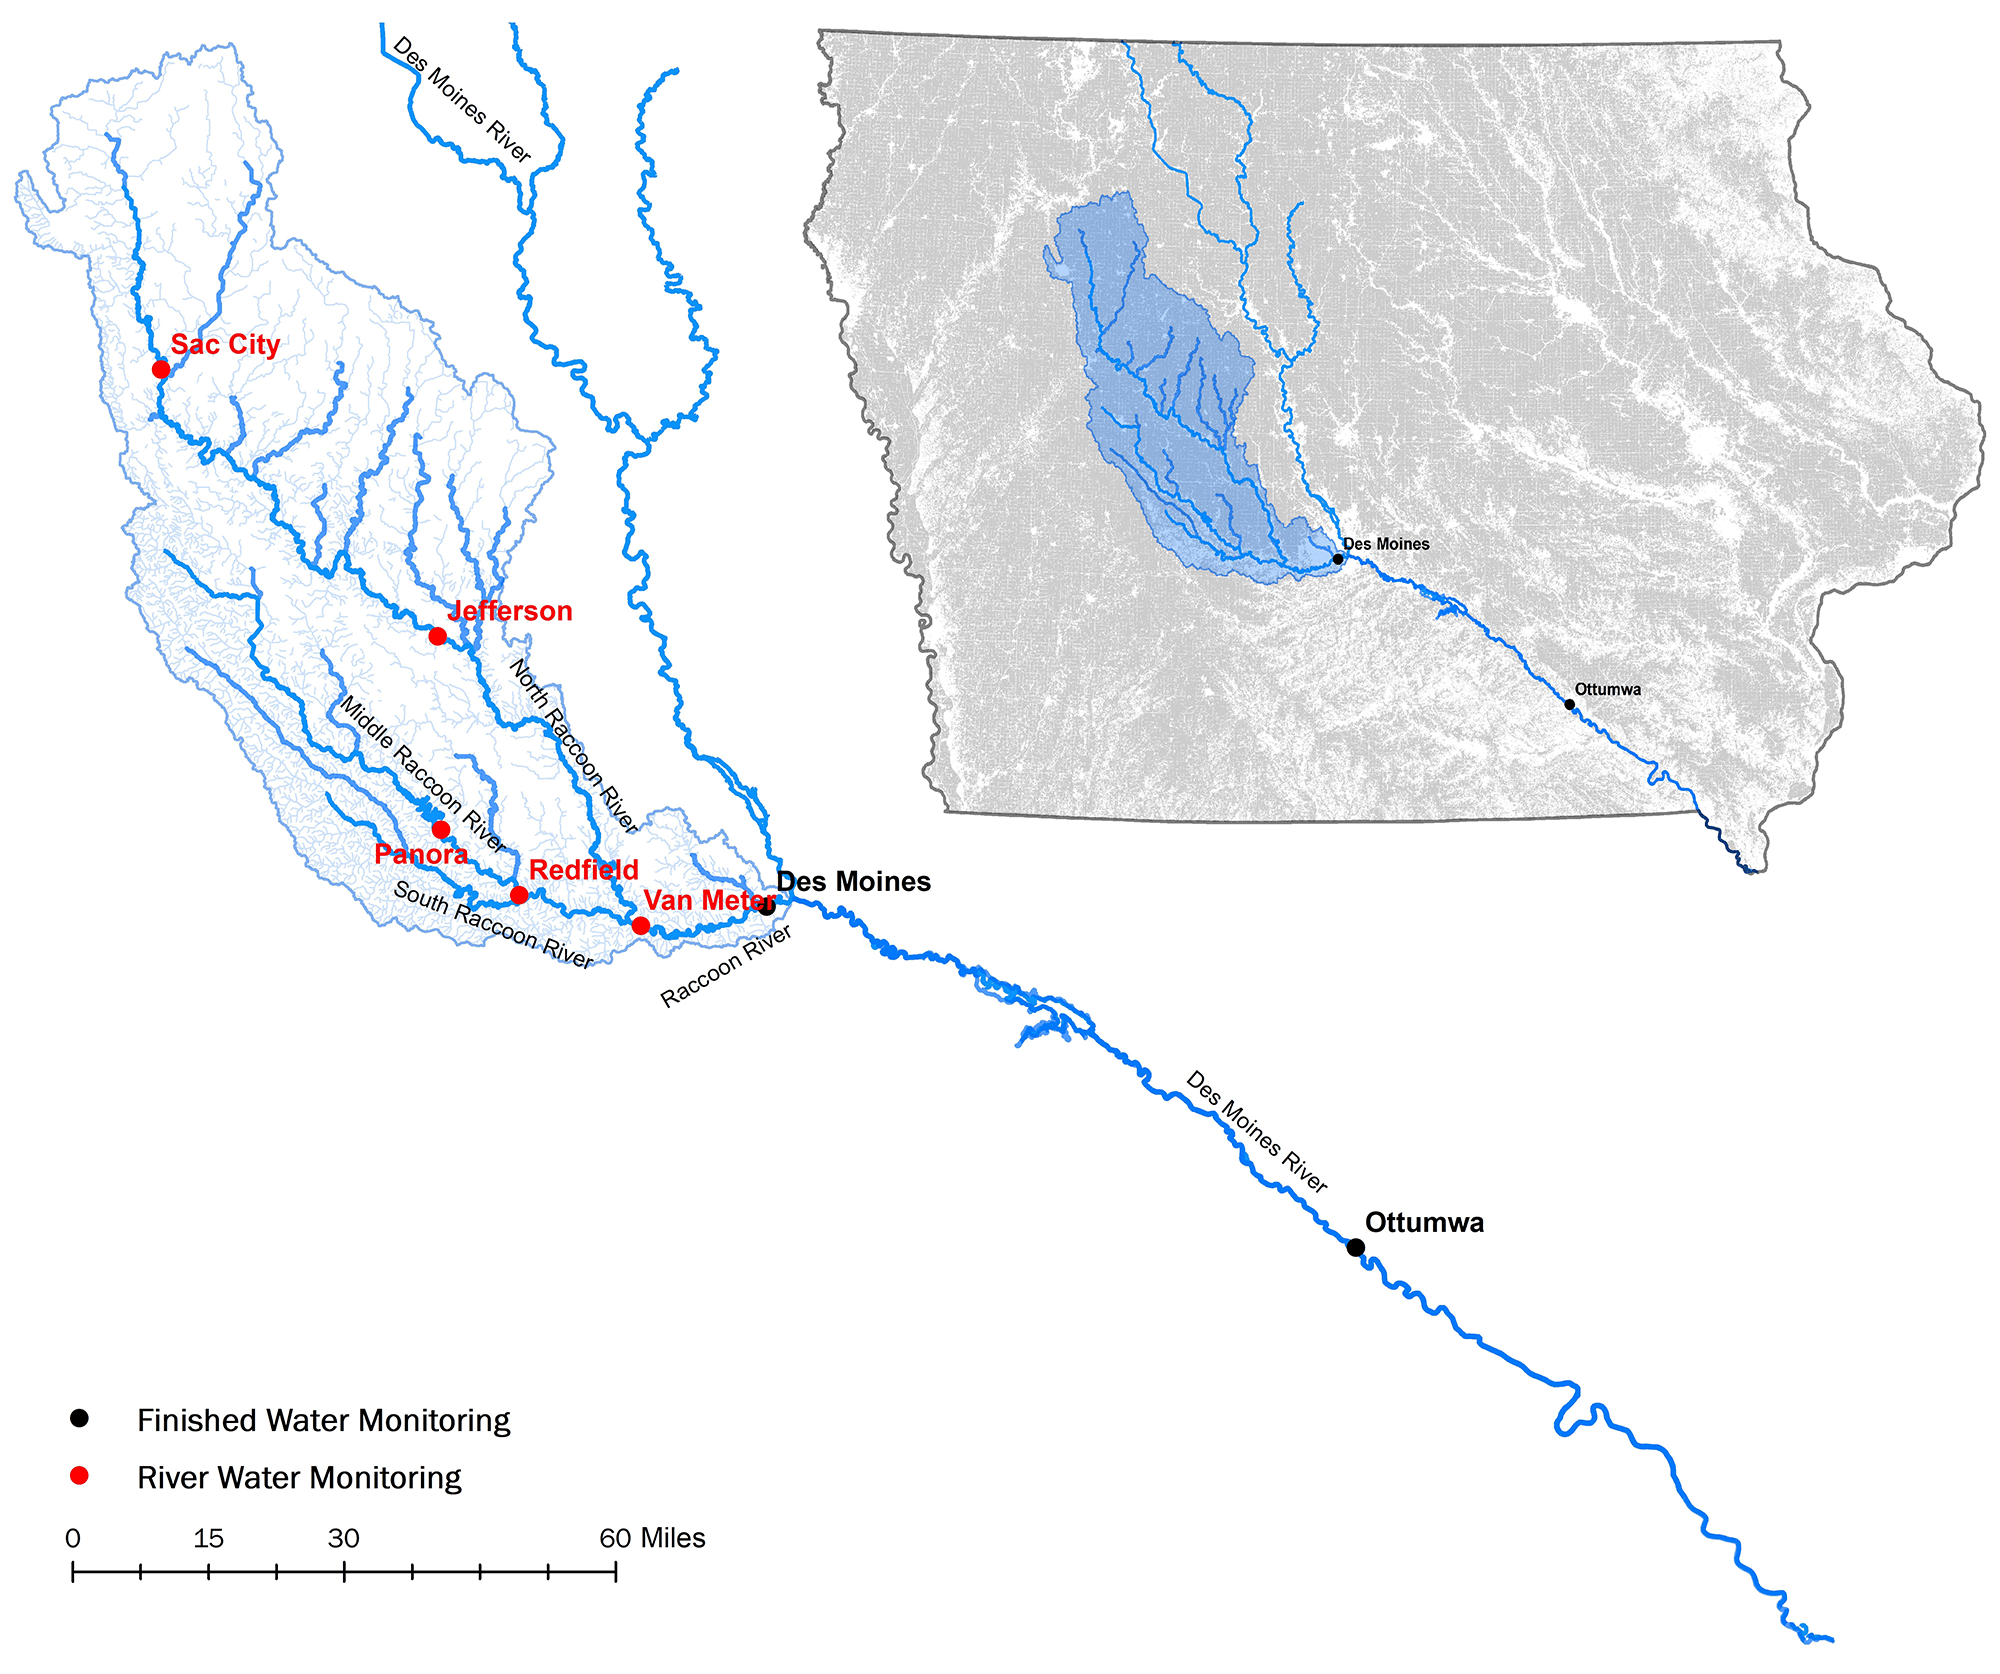
Source: EWG
Commercial fertilizers and manures contain a chemical called nitrate, a form of nitrogen, which gets into the river when rain washes it off fields. It can be fatal to babies who ingest too much of the chemical in tap water and it has also been linked to cancer in adults.
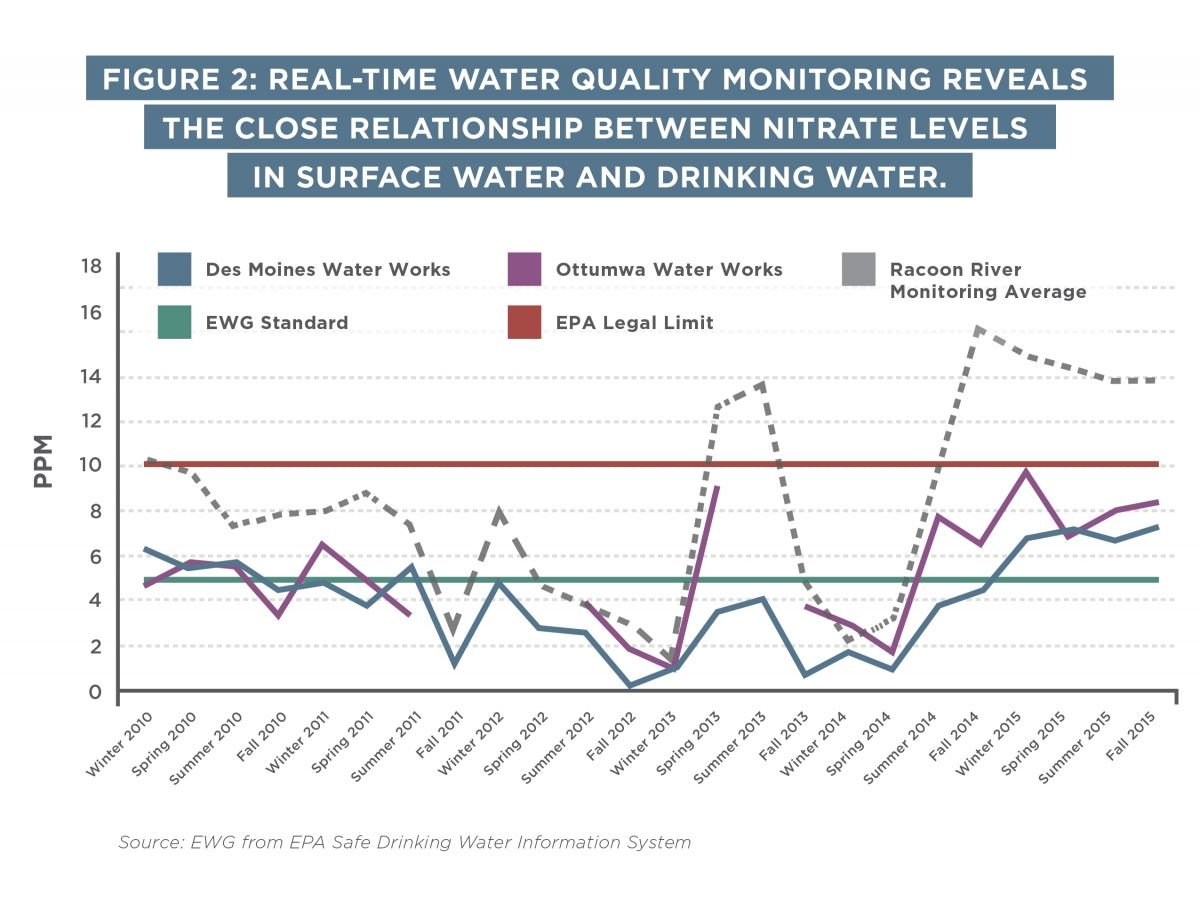
Between the spring of 2014 and the fall of 2015, the average nitrate level in untreated Raccoon River water was 11.12 parts per million, or ppm. The Environmental Protection Agency’s legal limit for nitrate in drinking water is 10 ppm. This standard was set 25 years ago to protect infants against so-called blue baby syndrome and has not been reviewed since. But recent studies by the National Cancer Institute have found that drinking water with just 5 ppm of nitrate increases the risk of colon, kidney, ovarian and bladder cancers. As such, the EWG Standard for nitrate is 5 ppm.
To keep average nitrate levels below the legal limit – although not below the level linked to an increased risk of cancer – the Des Moines Water Works treated the polluted river water with sodium chloride through a process called ion exchange. In 2014 and 2015, nitrate in treated, or “finished,” water from the utility averaged 5.16 ppm. During that period, average levels met the standard, but nitrate levels in individual samples of finished water went up and down, ranging from 0.08 ppm to 9.21 ppm.
Eighty miles downstream from Des Moines, the city of Ottumwa faced the same challenge of keeping nitrate in the water it served to its citizens below the legal limit.
Ottumwa, with a population of about 25,000, does not have a nitrate treatment system, but relies on blending Raccoon River water from other sources to bring down the level of the contaminant. In 2014 and 2015, nitrate levels in Ottumwa’s finished water averaged 6.42 ppm – again, below the legal limit but above the increased cancer risk level. In January 2015 the nitrate level was 9.7 ppm, perilously close to the legal limit.
Real-time water quality monitoring by the U.S. Geological Survey shows a strong correlation between seasonal averages of nitrogen in the river and nitrate levels in drinking water for Des Moines and Ottumwa (see Figure 2). When nitrate in the river spikes, the utilities manage to keep drinking water below the legal limit, but contamination consistently exceeds the increased cancer risk level.
Communities across Iowa face similar problems.
In 2014 and 2015, nitrate levels for tap water in 45 Iowa public water systems averaged at or above 5 ppm. All but three of those systems draw from groundwater under the surface, while the rest, like those of Des Moines and Ottumwa, depend on the river. According to data from the Iowa Department of Natural Resources’ Source Water Protection Program, 30 of the 45 systems drew from wells classified as highly susceptible to contamination.[4]
Private well water is also plagued by high levels of nitrate. A 2016 study by Iowa Watch, a nonprofit news organization, estimated that 288,000 Iowans rely on water from private wells. The study looked at nitrate levels in 28 wells throughout rural southwest Iowa in May and June of that year. They found nitrate levels as high as 168 ppm, with 11 wells at or above 45 ppm.
In 2016 the Iowa Department of Public Health tested more than 1,700 private wells for nitrate. It found that 19 percent were at or above the legal limit of 10 ppm.[5] This was up slightly from 2015, but down significantly from 2014, when 29 percent of the more than 5,000 wells tested had nitrate levels at or above the legal limit.
Nitrate not the only problem
Nitrate is not the only threat to drinking water polluted by agricultural runoff.
When it rains, the runoff from poorly protected farm fields carries phosphorous fertilizer and organic matter like manure, mud and crop residues into streams. Phosphorous triggers blooms of algae, which multiply the amount of organic matter in the stream.
To protect people from fecal bacteria or pathogens, utilities must disinfect the water with chlorine or other chemicals. But those chemicals react with algae and other organic matter in the water to produce disinfection byproducts. The byproducts, called trihalomethanes, or TTHMs, carry long-term health hazards.
Drinking tap water contaminated with TTHMs increases the risk of developing bladder cancer in humans. In animal studies, TTHMs are also associated with liver, kidney and intestinal tumors. Studies suggest that TTHMs increase the risk of problems during pregnancy as well, including miscarriage, cardiovascular defects, neural tube defects and low birth weight.
The EPA has set a legal limit of 80 parts per billion, or ppb, for TTHMs in drinking water. The limit was based on the technical feasibility of removing TTHMs from drinking water after disinfection and did not consider long-term toxicity. In 2010, California state scientists estimated that exposure to 0.8 ppm of TTHMs – 100 times lower than the federal legal limit – would pose a one-in-a-million lifetime risk of cancer.
EWG’s Tap Water Database, which collects test results from almost 50,000 utilities nationwide, shows that in 2014 and 2015, 33 water systems in Iowa had average nitrate levels at or above 75 percent of the legal limit for TTHM, or at 60 ppb. Three of those systems are in the Raccoon River watershed.
Who is responsible for cleaning the water?
Pollution of source water from farm runoff puts utilities between a rock and a hard place. They don’t control what happens in the watersheds or above the underground aquifers from which they draw drinking water. But utilities and their customers bear the cost of cleaning contaminants out of the water and adhering to federal regulations.
In 2015, the Des Moines Water Works brought a lawsuit against three upstream drainage districts within the Raccoon River watershed for nitrate pollution. They also sought to require the districts to obtain permits similar to those required under the Clean Water Act for industrial facilities and other so-called point source polluters. In 2017, the Iowa Supreme Court threw out the lawsuit on the grounds that the drainage districts were powerless to control farm runoff.
Iowa and some other farm states have conducted studies of how farmers can manage their lands to keep more nitrogen, phosphorus and other chemicals the soil, rather than running off into rivers, lakes and streams. Some states have codified these strategies and practices into reduction goals, but those rely on voluntary practices, for which farmers can receive taxpayer-funded assistance grants. But a look at two of those practices in the Raccoon River watershed show that voluntary programs are not enough.
Cover crops
Cover crops are grasses or other plants seeded to cover fields after the commercial crop has been harvested. They are remarkably effective at preventing mud, fertilizers and farm chemicals from running off of farm fields when it rains. Their roots also capture and hold nitrate in the soil that a commercial crop didn’t use, and keep it from flowing into streams or ditches or seeping into groundwater.
Capturing this unused nitrate is critically important in fields that have been underlain with pipes to drain water from the soil, a practice that improves crop yields. The pipes are buried a few feet below the surface, and send water out from below the surface into a ditch or stream. Miles and miles of these drainage pipes are buried beneath fields in the Raccoon River watershed (see Figure 3 below). Water from these pipes, which the Department of Agriculture estimates drain more than half of Iowa’s cropland, is the main source of nitrate polluting Des Moines’ drinking water.
Figure 3. Example of a drainage network beneath cropland.
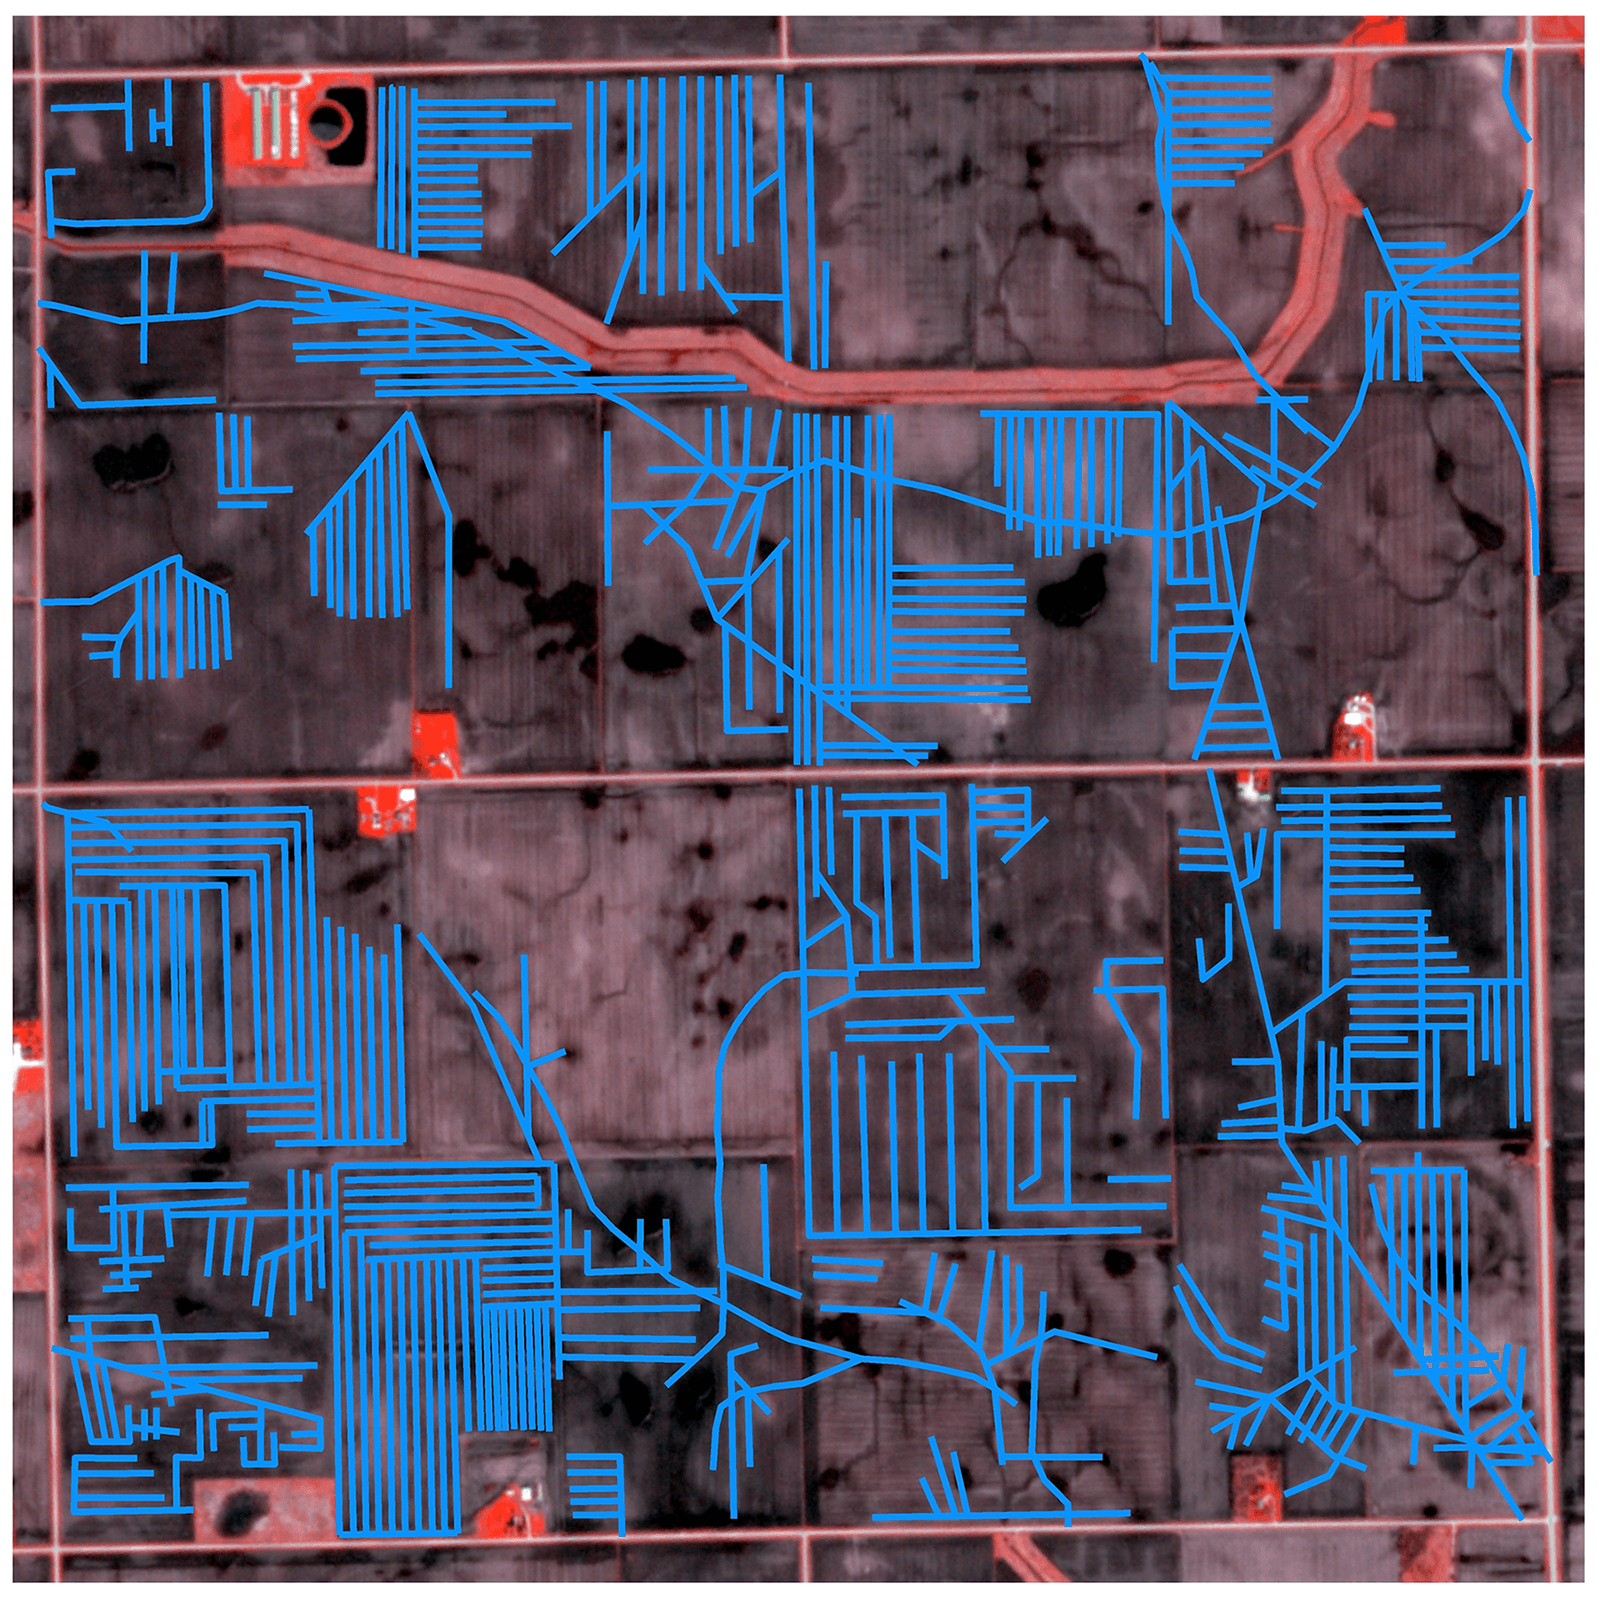
Source: EWG
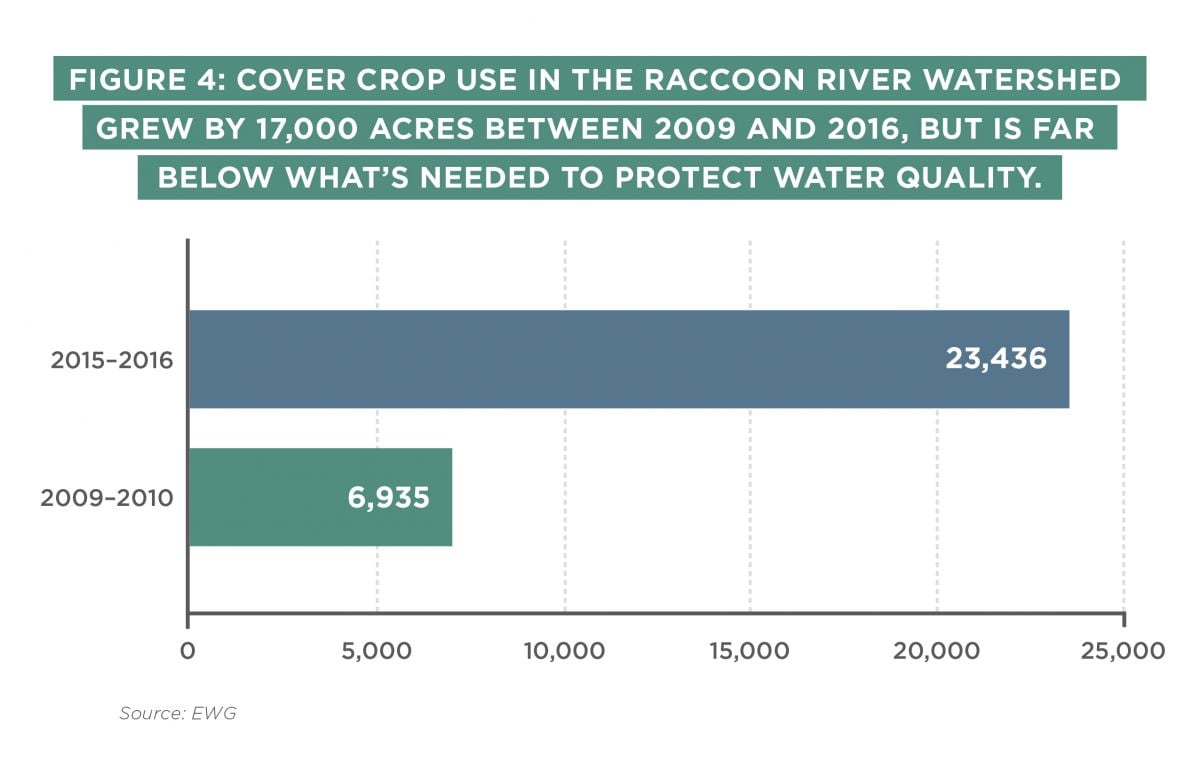
EWG used satellite imagery to locate fields protected with cover crops between 2009 and 2010, and between 2015 and 2016. The good news is in that period the amount of cover crops planted to protect the Raccoon River grew from 7,000 acres to nearly 24,000 acres. The bad news is those 24,000 acres are less than 2.5 percent of the amount of cover crops needed to clean up the watershed. Iowa’s Nutrient Reduction Strategy recommends that statewide, 60 percent of Iowa’s fields should be protected with cover crops every year. That would be more than 1.02 million acres in the Raccoon watershed – 43 times more than were protected in 2016.
Federal programs could do more to encourage planting of cover crops. Some progress is being made: In 2015, there were 163 contracts through the Environmental Quality Incentives Program to support planting of cover crops, up from just three in 2009. In counties within the Raccoon River watershed, support for cover crops through the Conservation Stewardship Program grew more slowly, from 26 in 2012 to 30 in 2015.
But that’s far from enough. A recent EWG mapping project shows that at current levels of spending, it would take 40 to 75 years before enough cover crops are planted to protect 60 percent of Iowa’s cropland.
Riparian buffers
Riparian buffers are strips of grass or trees planted between crops and streams. When it rains, the buffers filter mud, fertilizer, manure and other pollutants out of water running off fields. Buffers also strengthen stream banks that otherwise may collapse and foul streams with mud and other pollutants.
Riparian buffers are critically important to controlling phosphorus runoff, which can spark the growth of harmful algal blooms in streams, rivers and lakes. Algal blooms, along with mud and manure, are a major source of the organic matter that triggers TTHMs and other disinfection byproducts contaminating drinking water.
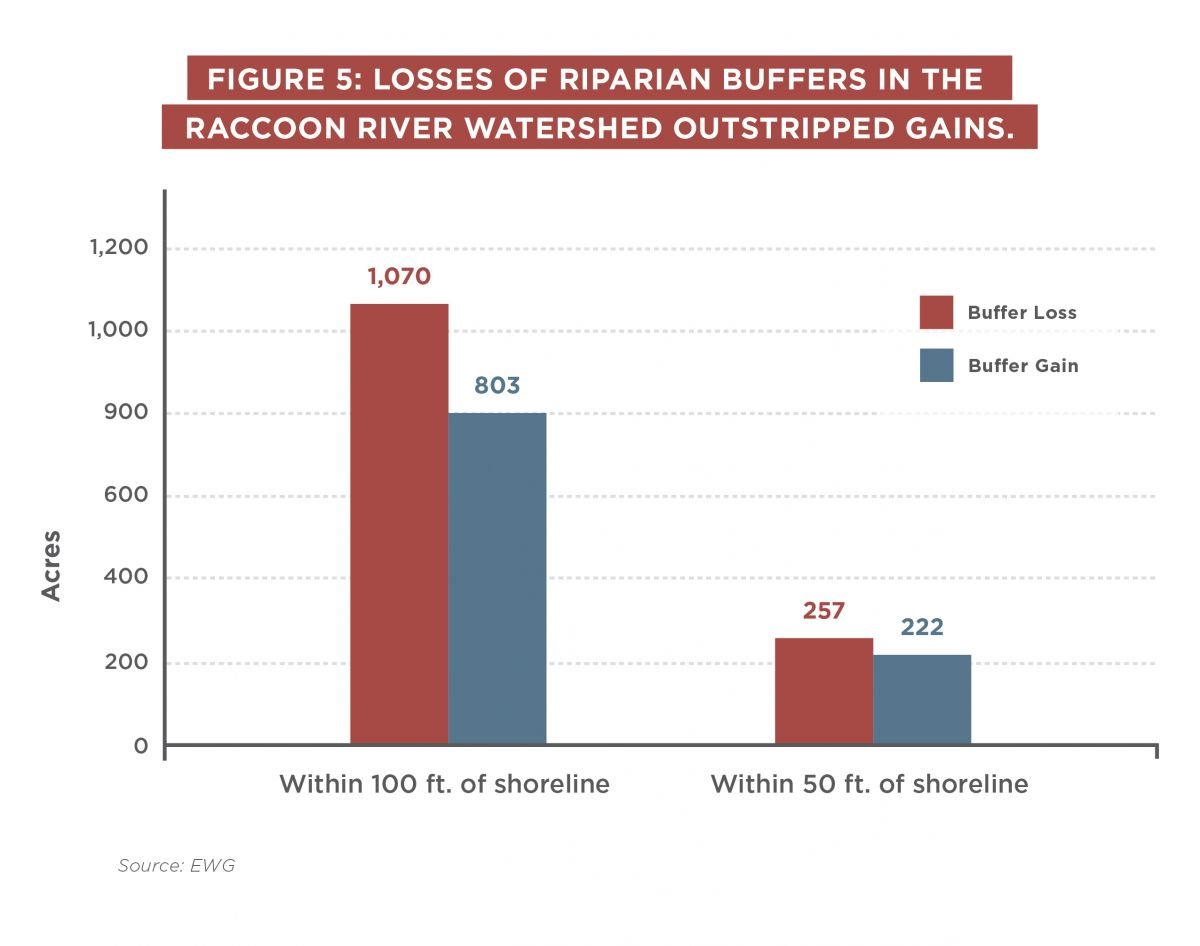
EWG used high-resolution satellite imagery provided by Planet – a private earth observation company – to check for buffers along over 2,500 miles of waterways bordered by cropland in the Raccoon River watershed. Our investigation compared acres of buffers within 100 and 50 feet of stream banks from 2010 to 2011 and 2015 to 2016.
We found a net loss, as some landowners added 803 acres of buffers within 100 feet of stream banks, but other landowners destroyed 1,070 acres of buffers. Losses also overwhelmed gains within 50 feet of stream banks. And almost one-fifth of the waterways had no protective buffers at all. Most of those streams are intermittent, flowing only after rains, but are still a major source of pollution.
Data from the federal Conservation Reserve Program confirmed our findings. In Raccoon River watershed counties, between 2009 and 2014, there was a net loss of 376 riparian buffer acres enrolled in the CRP.
See riparian buffer losses and gains on an interactive map.
Time to act
Time is running out for the millions of Americans who depend on water flowing through or under intensively farmed land. Exposure to high levels of nitrate and TTHM are putting their health at risk and increasing the cost of clean water. The cost of adding treatment systems to remove nitrate can be crippling for small communities.
Utilities are doing their best to deliver water within the legal limits, but it is an ever-increasing challenge as pollution of source water goes unchecked. EWG's Tap Water Database shows that from 2014 to 2015, water in more than 1,700 public water systems, serving over 6.7 million people, was contaminated with nitrate at or over an average of 5 ppm, the increased cancer risk level. More than 460 systems, serving more than 500,000 people, had average nitrate levels at or above 7.5 ppm.
Government programs that encourage farmers to act have an important role to play, and focusing these programs on getting the right pollution prevention practices in the right places would make them more effective. But decades of experience show that voluntary programs alone aren't enough.
Landowners who voluntarily adopt a protective practice can voluntarily take it out. Funding for these programs is inadequate to address the scope and scale of the problem. And it’s not fair to ask people already paying utilities to treat their water to also pay to keep contaminants out of the water in the first place.
It’s time for states to enact a basic standard of care – a set of common-sense pollution prevention practices that farmers and landowners should be expected to maintain as part of the responsibilities that go hand-in-hand with the rights of land ownership.
States should tighten existing standards or enact new standards to ensure fertilizers and manure are applied when, where and in the right amount to prevent pollution. Minnesota now requires 50 feet of protective vegetation between cropland and public waterways. More states should follow suit. Landowners should be expected to take simple and well-understood measures to prevent gully erosion that delivers mud, fertilizer, manure and farm chemicals to waterways.
The basic standard of care should be tailored to reflect differences between farming systems and local watersheds, or unique threats to water quality. But a basic set of standards must be in place in every county to create a solid foundation on which a far more effective suite of voluntary government programs can be built.
Beyond state action, reauthorization of the federal farm bill in 2018 is a remarkable opportunity to jump-start progress.
But it is more than fair to expect farmers and landowners to expand their efforts to protect the environment in return for the generous farm and insurance subsidies they receive. According to the Congressional Budget Office, in 2016 alone, those subsidies totaled $14.5 billion, with a projection of another $64.3 billion in spending over the next five years.
The conservation compact between farmers and taxpayers in the 1985 Farm Bill sparked dramatic progress in cutting runoff from the most vulnerable cropland and saving wetlands. More than 30 years later, it’s time for Congress to require all subsidized growers and all the cropland they farm to meet conservation standards to cut polluted runoff.
To remain eligible for farm program benefits and crop insurance premium subsidies, farmers and landowners should take steps on all annually planted cropland earning subsidies to:
- Achieve a rate of soil erosion no greater than the soil loss tolerance level on all annually planted cropland;
- Prevent ephemeral gully erosion; and
- Establish and maintain a minimum of 50 feet of perennial vegetation between annually tilled cropland and intermittent or perennial waterways.
Many farmers are likely already doing everything needed to meet their obligations under a new and stronger conservation compact. Those who aren’t should have five years to get their plans in place and another five years to fully apply the plans on their farms.