As the White House and some members of Congress call for more domestic oil and gas drilling, federal and industry data show that the Bush Administration has allowed more drilling on Western federal lands than any Administration in the last 25 years. Yet prices for gasoline and natural gas have soared and dependence on foreign energy sources continues to climb.
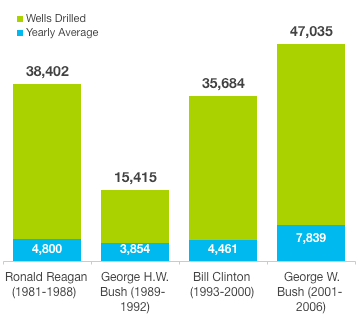
From 2001 to 2006, drilling on public land in the West averaged 7,839 wells per year, 60 percent higher than the 4,800 wells drilled annually from 1981 to 1988, when the Reagan Administration opened vast tracts of the West to energy development during the so-called Sagebrush Rebellion (IHS 2008).
Drilling on Western Public Lands is Highest in At Least 25 Years
Source: IHS Energy (IHS). 2008. PI/Dwights Plus Energy Well Data, Rocky Mountain, Volume 18, Issue 5, Released May 1, 2008 and IHS Energy (IHS). 2008. PI/Dwights Plus Energy Well Data, West Coast/Alaska, Volume 18, Issue 5, Released May 1, 2008. U.S. Department of the Interior, Minerals Management Service (MMS). 2008.
Note: New Mexico excludes wells drilled in the Permian Basin in the southeastern corner of the state. That data is included in a separate IHS database. The wells include those drilled in 12 Western states: AZ, CA, CO, ID, MT, NM, NV, OR, SD, UT, WA, WY. There were no wells drilled in OR or WA.
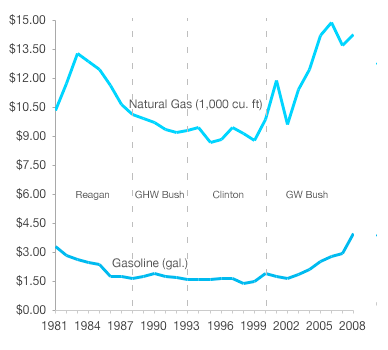
Yet despite this dramatic increase in drilling, inflation-adjusted prices for gasoline have soared from $1.77 a gallon in 2001 to $2.80 in 2006 on their way to the current average of about $4 (EIA Real Petroleum Prices 2008). Residential natural gas prices rose from an average of $11.90 per 1,000 cubic feet in 2001 to $14.92 in 2006, settling at $14.30 this spring (EIA Natural Gas Prices 2008). Dependence on foreign oil increased from about 55 percent in 2001 to 59 percent in 2006 and stood at 58 percent last year (EIA Petroleum Review 2008). Dependence on foreign natural gas remained relatively constant, declining slightly from 16.2 percent in 2001 to 16.0 percent in 2006 and then rising to 16.4 percent last year (EIA Natural Gas Review).
Despite Increased Drilling in the West, Gasoline and Natural Gas Prices Have Soared
Source: Energy Information Administration. Natural Gas Prices. Accessed online July 3, 2008 and Short-Term Energy Outlook, Real Petroleum Prices. Accessed online July 3, 2008.
Note: Natural gas prices are reported in residential price, and all of the prices are adjusted to 2008 dollars.
Drilling on federal lands increased sharply under the Bush Administration because higher prices for oil and particularly natural gas sparked a rush to drill and because the administration aggressively promoted drilling. But the data show that increased access to Western public lands will not result in lower energy prices for consumers and it will not decrease our dependence on foreign oil or natural gas. Rather than a rush to drill, our energy policy should emphasize careful stewardship of public lands given the use of toxic chemicals, waste pits, heavy equipment and other impacts inherent in drilling. These impacts put at risk the precious water supplies and natural beauty that are essential to the West's long-term economy.
Drilling offshore or in the Arctic National Wildlife Refuge is not the answer either. Drilling these sensitive areas would only perpetuate our dependence on polluting energy sources and delay a serious commitment to alternatives. According to the Department of Energy, offshore drilling of areas currently off-limits will not yield any measurable oil production until 2030 and the Arctic refuge would not produce oil until 2018 (EIA OCS 2008, USGS Arctic 1998).
The best way to control energy prices and foreign dependence is by reducing demand with immediate, major and mandatory investments in conservation measures such as mass transit, higher mileage cars, improved building codes, tougher efficiency standards for appliances and lighting, and through the promotion and development of available alternative energy sources like solar and wind. In fact, prices have already declined somewhat likely due to reduced demand caused by higher prices. (Mouawad 2008). Yet without government investment in alternative fuels and transportation, Americans are likely to continue to experience an energy squeeze.
Drilling Surges on Public, Private, Tribal Lands, but Oil Production Declines
Drilling on all Western lands -- federal, state, private and tribal -- tracked the increase in drilling on federal lands. Between 2001 and 2006, energy companies drilled an average of 12,389 wells per year, 50 percent greater than the 8,229 wells drilled annually during the Reagan Administration (IHS 2008). The annual number of wells drilled on all land in the West averaged just 5,841 under the administration of George H. W. Bush and 6,881 under Bill Clinton (IHS 2008). The data often do not indicate whether individual wells were drilled for oil or natural gas or both.
Yet oil production on Western public lands remained far too small to impact prices and continued a steady decline, reflecting a general lack of oil in the West and the diminishing returns from older wells.
Average Annual Oil Production on Western Public Lands Has Steadily Declined
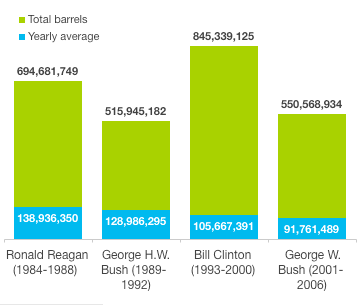
Source: U.S. Department of the Interior, Minerals Management Service (MMS). 2008. Federal Onshore Oil and Natural Gas Sales Volumes by Calendar Year, 1984-2006. Data prior to 1984 is not complete, so production under Reagan excludes 1981-1983.
Production on Western public lands declined from 138 million barrels a year in the Reagan Administration to 92 million a year under George W. Bush, according to data from the Department of Interior’s Minerals Management Service (MMS 2008). Total U.S. consumption has exceeded 7 billion barrels per year since 1998, meaning that the amount currently produced from Western federal lands is equivalent to about 1 percent of consumption (EIA Petroleum Review 2008).
Oil production on all lands in the West followed the same trend, with oil production declining from about 627 million barrels per year between 1981 and 1998 to 408 million barrels per year between 2001 and 2006 or about 6 percent of U.S. consumption (EIA Oil Production 2008).
Oil and gasoline prices have spiked largely because of increased global demand and escalating costs of production (Yergin 2008, BP 2008). These rising production costs are driven by more expensive raw materials required for drilling such as steel and by increasingly hard-to-access oil deposits (Yergin 2008, Global Insight 2007).
“Even in Saudi Arabia, home to more than a quarter of the world’s oil, the age of cheap and easily pumped oil is over,” reports The Wall Street Journal, noting that to tap the new Khurais oil field the kingdom “has embarked on the most complex earth-and water-moving project in its history. It is spending up to $15 billion on a vast network of pipes, oil-treatment facilities, deep horizontal wells and water-injection systems.” The project includes a 120-mile pipeline to bring vast quantities of seawater inland from the Persian Gulf that will be pumped into the ground at the rate of more than 100 million gallons a day to push oil to the surface (King 2008).
Some argue that investors are playing a role in pushing oil prices higher – and investment dollars have flowed into the oil market. But other observers say that if investors were really driving prices, there would be more hoarding of oil supplies as investors sought to set aside oil to sell at a higher price later. The lack of such hoarding indicates that market demand is a more important reason for the price increases (Cho 2008, Lahart 2008).
Natural Gas Production Rises, But So Do Prices
Unlike oil, natural gas production has increased throughout the West, reflecting the greater quantities of natural gas beneath Western lands. But natural gas prices have soared for some of the same reasons that oil prices have risen.
Natural gas production on Western public lands increased from about 750 billion cubic feet per year under the Reagan Administration to 2.4 trillion cubic feet per year under George W. Bush (MMS 2008). In comparison, total U.S. consumption has averaged 22 trillion cubic feet per year since 1993, meaning that the amount of natural gas produced from Western public lands is about 11 percent of total consumption (EIA Natural Gas Review 2008). The increase in natural gas production on all Western lands was similar, rising from about 2.1 trillion cubic feet per year between 1981 and 1988 to 4.9 trillion cubic feet annually between 2001 and 2006, or more than 20 percent of U.S. consumption (EIA Natural Gas Production 2008).
Natural Gas Production on Western Public Lands
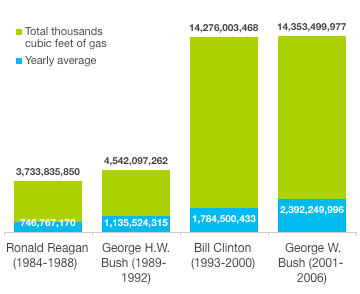
Source: U.S. Department of the Interior, Minerals Management Service (MMS). 2008. Federal Onshore Oil and Natural Gas Sales Volumes by Calendar Year, 1984-2006. Data prior to 1984 is not complete, so production under Reagan excludes 1981-1983.
Yet despite the increase in drilling and production in the Western U.S., prices have soared. North American natural gas production overall has remained flat, IHS reported, and consumption has outstripped production, keeping the market tight and requiring a creeping increase in imports (IHS Diminishing Returns 2007, EIA Natural Gas Review 2008). In addition, many of the wells drilled in the West are in unconventional deposits such as coal bed methane, raising costs (IHS Diminishing Returns 2007).
“The shift toward unconventional gas production was prompted by the clear inability of conventional gas resources to keep pace with gas consumption,” said Robert Ineson, director of North American gas research at Cambridge Energy Research Associates, in “Diminishing Returns," a 2007 report on North American natural gas production. “With [liquefied natural gas] imports growing, but not fast enough to serve the appetite of the market,” Ineson said, “unconventional gas, even resources that are relatively expensive, are good options for gas producers for several more years” (IHS Diminishing Returns 2007).
State Drilling Totals: Wyoming Sees Biggest Increase
Wyoming saw the largest increase in wells drilled on federal land of any Western state. Drilling more than doubled from fewer than 1,000 wells drilled per year under Reagan, George H. W. Bush and Bill Clinton, to more than 2,600 annually under George W. Bush. Colorado, Montana, New Mexico and Utah also saw seen significant increases in drilling between 2001 and 2006 (IHS 2008).
Wells Drilled on Federal Land in Western States
| State | Ronald Reagan (1981-1988) |
George H.W. Bush (1989-1992) |
Bill Clinton (1993-2000) |
George W. Bush (2001-2006) |
| WY | 7,901 | 2,541 | 7,824 | 15,670 |
| CA | 19,468 | 6,879 | 15,348 | 13,558 |
| CO | 3,248 | 2,215 | 4,696 | 6,959 |
| NM | 3,208 | 3,208 | 3,844 | 4,957 |
| UT | 1,883 | 665 | 2,028 | 3,281 |
| MT | 2,235 | 674 | 1,729 | 2,511 |
| SD | 212 | 42 | 73 | 77 |
| NV | 207 | 127 | 138 | 21 |
| AZ | 28 | 4 | 4 | 1 |
| ID | 12 | 0 | 0 | 0 |
| Total | 38,402 | 15,415 | 35,684 | 47,035 |
| Average Per Year | 4,800 | 3,854 | 4,461 | 7,839 |
The largest statewide increase in drilling on all land (federal, state, private and tribal) also occurred in Wyoming where drilling more than doubled from fewer than 1,900 wells drilled per year under Reagan, George H.W. Bush and Clinton to more than 4,200 under George W. Bush. IHS data also showed significant increases for drilling on all land in Colorado, Montana, New Mexico and Utah (IHS 2008). New Mexico likely recorded even larger increases in drilling on both federal land and all land because wells drilled in the southeastern corner of the state in the Permian Basin were not included in the IHS data that EWG reviewed.
All Wells Drilled in Western States (Federal, State, Private, Indian)
| State | Ronald Reagan (1981-1988) |
George H.W. Bush (1989-1992) |
Bill Clinton (1993-2000) |
George W. Bush (2001-2006) |
| WY | 11,861 | 3,770 | 14,897 | 25,423 |
| CA | 27,422 | 8,614 | 18,348 | 17,577 |
| CO | 12,503 | 5,933 | 10,590 | 14,972 |
| NM | 4,910 | 2,597 | 4,756 | 6,593 |
| MT | 5,283 | 1,247 | 3,134 | 5,268 |
| UT | 2,983 | 948 | 2,962 | 4,311 |
| SD | 336 | 57 | 106 | 121 |
| NV | 237 | 141 | 139 | 33 |
| OR | 155 | 35 | 49 | 17 |
| WA | 39 | 9 | 33 | 9 |
| AZ | 63 | 11 | 31 | 8 |
| ID | 37 | 0 | 0 | 0 |
| Total | 65,829 | 23,362 | 55,045 | 74,332 |
| Average Per Year | 8,229 | 5,841 | 6,881 | 12,389 |
Recommendations
Because increased demand for oil and natural gas is likely the major reason for increased energy prices, investments in conservation and renewable energy are the best solutions because they reduce demand.
Invest in Transit, Amtrak
Investments in energy efficient public transit ought to be a major part of the solution. The city of Atlanta has shown that even the most sprawling, traffic-choked communities can reduce energy consumption and provide effective transportation alternatives. In July 1996, Atlanta implemented a plan to reduce pollution for the Olympic Games that featured a round-the-clock public transportation system, 1,000 additional buses, closure of the downtown to private cars, as well as alternative work hours and telecommuting for businesses.
“Something special and unusual happened in Atlanta during the Olympics,” the Atlanta Journal-Constitution reported. “Traffic flowed. The air was cleaner. And Atlantans changed their commuting habits. They rode transit. They teleworked. And they adopted flexible work hours.
“As a result, during the entire three weeks of the Olympics, held in the middle of an Atlanta summer, the air never exceeded pollution standards” (Saporta 2006).
A study published in the Journal of the American Medical Association found that the number of emergency asthma admissions for children at Atlanta-area hospitals declined by 40 percent during the Olympics. The study reported that weekly gasoline sales in Atlanta were not available, but statewide sales in July 1996 (the Olympics were held for 17 days of the month) were four percent lower than they were in June and August. July sales in 1995 and 1997 were 1.2 percent higher than in June and August of those years, suggesting that gasoline sales would have increased statewide in Georgia in July 1996 without Atlanta’s alternative transportation plan (Friedman 2001).
As for intercity rail, higher gasoline prices have likely pushed Amtrak ridership higher in recent months but, as The New York Times reported, there is a limit to how many additional passengers Amtrak can accommodate because rail travel had previously declined and Congress failed to invest in basic infrastructure and maintenance (Wald 2008). The federal government should reinvest in Amtrak.
Set and Raise Real Fuel Efficiency Standards
EWG previously found that simply by using real-world measures of driving to set fuel efficiency standards rather than current, bogus standards that underestimate speeds (average highway test speed: 49 mph) and acceleration among other flaws, the U.S. could have imported 20 percent less oil in 2005, about 710 million barrels per year or almost eight times the average of 92 million barrels per year that our Western public lands produced during the Bush Administration (EWG Real MPG 2006).
The EPA recently enacted new standards that will change mileage tests to better reflect real world driving conditions. However, the new tests apply only for the purpose of more accurately reflecting a car’s gas mileage on window stickers. Automakers will still be able to comply with federal mileage standards using the old, bogus test (EPA Fuel Economy 2006). Congress should require a single test that reflects real-world driving conditions for window stickers and fuel economy standards.
Congress should increase fuel efficiency standards and the Administration should implement them quickly. Last year, Congress passed legislation that increased fuel economy standards to a fleet average of at least 35 miles per gallon by 2020. Given today’s gasoline prices, this increase is too low and the timetable is far too long. At a recent hearing, lawmakers criticized the Department of Transportation for using estimated gas prices of $2.42 in 2016 and $2.51 in 2030 to set standards under the law. The lawmakers argued that the legislation would require automakers to increase fuel efficiency more rapidly if prices were estimated to be higher, as they are now (Voorhees 2008, Markey et al. 2008). The Administration should use gasoline prices that more accurately reflect what drivers are likely to pay in setting efficiency standards.
Increase Efficiency Standards for Appliances and Buildings
Increased energy efficiency standards for appliances and buildings can also mitigate the demand for more natural gas and oil. The Bush Administration wants to allow drilling on top of Roan Plateau, a fragile sportsman’s paradise in western Colorado where the Administration projects that drilling would produce 240 billion cubic feet of natural gas (BLM Roan Production 2006). The American Council for an Energy Efficient Economy (ACEEE) estimated in 2001 that improved efficiency standards for ceiling fans would save the equivalent of 293 billion cubic feet of natural gas, eliminating the need to drill on this sensitive land (ACEEE Appliances 2001).
Invest in Renewable Energy
Renewable energy such as solar and wind, can reduce demand for oil and natural gas. For instance, the Bush Administration wants to allow drilling for natural gas and oil in Otero Mesa, a pristine grassland with significant water resources in southern New Mexico. New Mexico Gov. Bill Richardson estimates that this energy production could be replaced with 110 wind turbines (Richardson, 2004).
Drilling Offshore or in the Arctic Refuge is Not the Answer
“Access to the Pacific, Atlantic, and eastern Gulf regions would not have a significant impact on domestic crude oil and natural gas production or prices before 2030,” the Energy Information Administration reported in an analysis of the energy that would be produced from offshore areas currently closed to drilling. Even if drilling were allowed, the amount of technically recoverable oil in these areas is equivalent to less than 2.5 years of our current consumption while the amount of natural gas is larger but equivalent to just 3.5 years of current consumption – and these data do not reflect the total amount of energy that can be economically recovered (EIA Petroleum Review 2008, EIA Natural Gas Review 2008, EIA OCS 2008).
If drilling were allowed in the Arctic National Wildlife Refuge in 2008, production would not begin until 2018, the EIA reported. And even then, the USGS estimates that drilling in the refuge would provide over its life only about a year’s worth of U.S. consumption at current levels. The estimate for oil in the refuge is also technically recoverable and not necessarily economically recoverable (USGS Arctic 1998).