Overview
- Crop insurance indemnities paid out a record $19.1 billion to farmers in 2022.
- Payments were largely concentrated in just 10 states and covered mostly four commodity crops.
- The 2023 Farm Bill is an important opportunity to improve the federal Crop Insurance Program and cut costs.
The federal Crop Insurance Program was created to insure farmers against crop losses. But because of how the program is designed and has been managed over time, it actually only protects around 20 percent of U.S. farms, even as the costs to do so skyrocket.
A new EWG analysis finds that crop insurance mostly benefits larger farms that grow just a few crops in a handful of states. And the program’s unique configuration means that it is administered through a “public-private partnership” that pays billions of dollars every year to crop insurance companies and agents – all heavily subsidized by taxpayers.
EWG also discovered that during the past 22 years, insurance indemnities, or payouts to farmers for reductions in yield or revenue, rose significantly: from $2.96 billion in 2001, when current subsidy levels were set, to a record $19.13 billion in 2022 – an increase of well over 500 percent.
Farmers in just 10 states received the majority of crop insurance payouts. Nationally, three-fourths of payments went to growers of just four crops: corn, soybeans, wheat and cotton.
Crop insurance indemnity payments are not the only costs of the program that have gone up over time. Premium subsidies, which are the direct costs of the program to taxpayers, have also risen over the same 22-year period. And the percentage of total premiums paid by taxpayers has grown, while the share paid by farmers has shrunk.
As the climate emergency accelerates changes to weather systems and increasingly wreaks havoc on farms, the Crop Insurance Program’s current iteration is simply not sustainable.
Without meaningful reform to this vital Department of Agriculture program, crop insurance costs will continue to spiral, burdening both farmers and taxpayers with astronomical expenses and doing little to provide an effective safety net for all farmers.
Congress must improve the federal Crop Insurance Program in the upcoming farm bill to lower costs to taxpayers and to distribute payments more equitably among farmers.
Lawmakers have many options for undertaking such reforms, including reducing premium subsidies for farming on high-risk land and cutting back payments to crop insurance companies and insurance agents. The 2023 Farm Bill is an important chance to reform the program.
Soaring crop insurance payouts reached a record high in 2022
In 2022, crop insurance indemnities were the highest they’ve been since 2001, when current subsidy rates were set. Before 2001, the program was subsidized at a lower rate and consequently had fewer participating farmers and lower costs.
Between 2001 and 2022, the federal Crop Insurance Program sent out over $161.63 billion in indemnity payments to farmers. These payouts grew 546 percent between 2001, when they were $2.96 billion, and 2022, when they were a record $19.13 billion (Figure 1).
While indemnities didn’t increase every year between 2001 and 2022, the overall trend has been rapid growth, and on average they climbed 20 percent each year.
Figure 1. Crop insurance payments surged between 2001 and 2022.
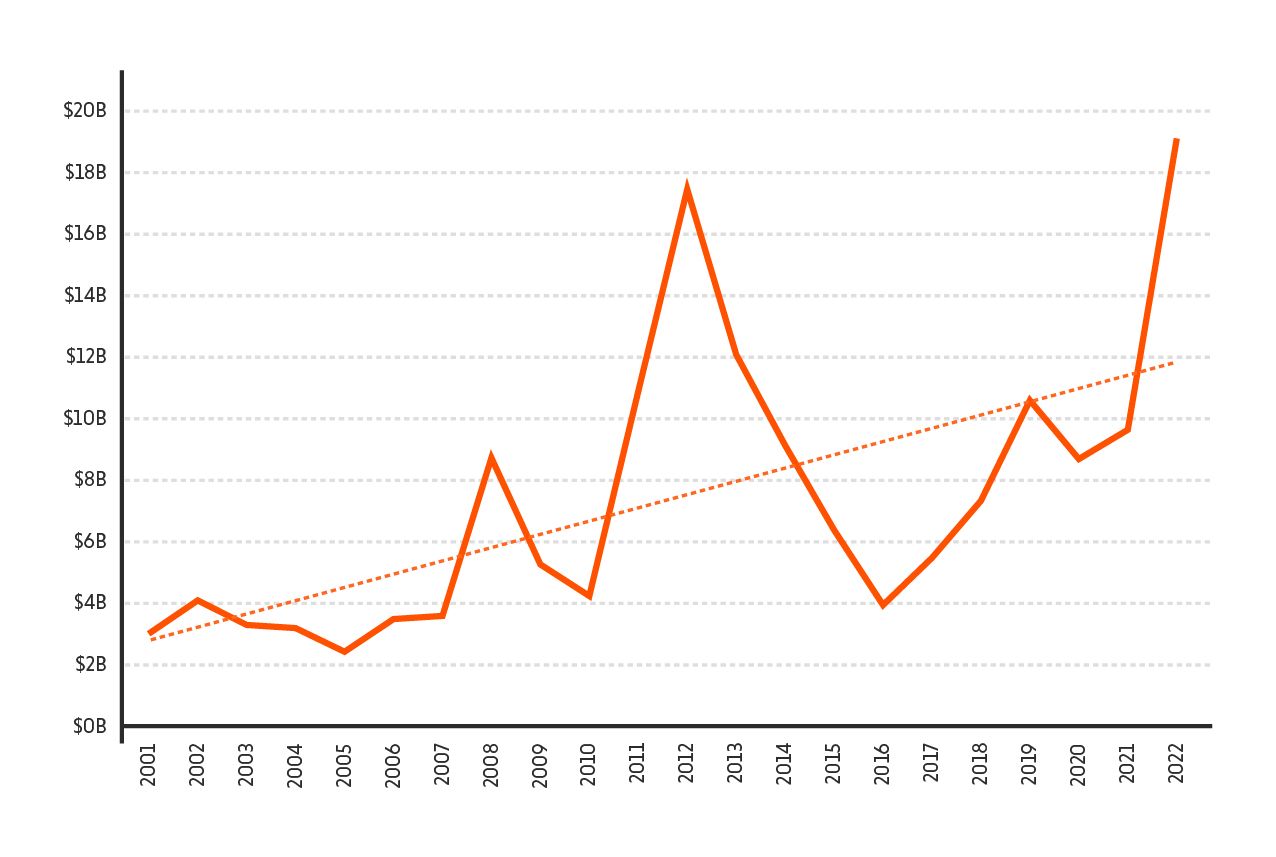
Source: EWG, from the USDA’s Risk Management Agency, Summary of Business Report Generator
Over the 22-year period examined by EWG, there was only one year with payments anywhere near the level of 2022. The drought year of 2012 saw the Crop Insurance Program sending out $17.45 billion in indemnities – still $1.68 billion below 2022’s record $19.13 billion. The year with the next-highest total payments was 2013, with $12.08 billion.
To get a payout from the program, farmers must first buy an insurance policy from a private company that has an agreement with the federal government. Insured farmers pay for part of the policy’s total premium, while taxpayers pay the remainder, called the premium subsidy.
When a farmer has a reduction in crop yield or revenue – depending on the type of policy they have – they receive a payment, or indemnity, from the total premium money. So indemnities come from a pool of money supplied by both taxpayers and farmers.
Payments are concentrated in a few states and mostly go to a handful of crops
Crop insurance payments are incredibly concentrated: Farmers growing only a few crops in a handful of states receive most of the payments.
From 2001 through 2022, farmers in just 10 states reaped almost two-thirds of all payments (Table 1). Growers in these states – California, Illinois, Iowa, Kansas, Minnesota, Missouri, Nebraska, North Dakota, South Dakota and Texas – received over $104.6 billion, or 65 percent of all crop insurance indemnities. And of these states, farmers in just three – Texas, North Dakota and Kansas – got 30 percent of all payments nationwide.
Table 1. Farmers in 10 states received almost two-thirds of all crop insurance payments between 2001 and 2022.
| State | Payments 2001-2022 | State rank | Percent of total payments |
|---|---|---|---|
| Texas | $23,208,903,527 | 1 | 14% |
| North Dakota | $13,965,851,214 | 2 | 9% |
| Kansas | $11,026,299,334 | 3 | 7% |
| Iowa | $10,176,500,669 | 4 | 6% |
| South Dakota | $9,567,519,339 | 5 | 6% |
| Illinois | $8,750,588,093 | 6 | 5% |
| Minnesota | $8,280,357,128 | 7 | 5% |
| Nebraska | $7,496,115,734 | 8 | 5% |
| California | $6,643,074,073 | 9 | 4% |
| Missouri | $5,501,889,641 | 10 | 3% |
| Total top 10 states | $104,617,098,752 | 65% |
Source: EWG, from the USDA’s Risk Management Agency, Summary of Business Report Generator
Most crop insurance payments were concentrated to farmers growing an even smaller number of crops. Just four crops, all of which are commodities – corn, soybeans, wheat and cotton – were responsible for fully three-fourths of all indemnity payouts. Over $55.36 billion in indemnities – 34 percent of total crop insurance payouts – went to corn growers.
Perhaps not surprisingly, then, EWG found that, in 19 states, corn received the most payouts out of all crops.
Map of the states and the crops that received the most total crop insurance payments in each state between 2001 and 2022.
Direct costs to taxpayers have rapidly risen
As outlined above, indemnities are partially funded by farmer insurance premium payments. But premium subsidies are one of the direct costs to taxpayers of the federal Crop Insurance Program, since taxpayers pay for 100 percent of them.
These subsidies totaled $118.16 billion between 2001 and 2022. In 2022, premium subsidies were $11.63 billion, also a record high – and a 557 percent rise over 2001, when premium subsidies were $1.77 billion.
The share of total premiums paid for by taxpayers has also grown since 2001, while farmers’ share has gone down. On average, taxpayers have paid 62 percent of premiums between 2001 and 2022, while farmers paid only 38 percent.
In 2001, taxpayers’ share made up 60 percent of the total, and in some years in the early 2000s, taxpayers paid 58 or 59 percent. But since 2016, taxpayers have paid 63 percent of premiums every year, with farmers only contributing 37 percent.
Reforms are vital to address growing program costs
The federal Crop Insurance Program needs to be modernized to better serve farmers, cut costs for taxpayers and strengthen American agriculture against the extreme weather linked to climate change. Many of these reforms have had bipartisan support in the past.
Congress could pass multiple reforms to help:
- Reduce subsidies to crop insurance agents.
- Decrease underwriting gains paid to crop insurance companies.
- Lower premium subsidies on high-risk land to reflect the risks that farmers are taking.
- Improve transparency of crop insurance subsidies, in alignment with more-transparent farm subsidy programs.
- Require a means test to qualify for crop insurance premium subsidies, like farm subsidy programs have.
- Create a cap on how much money in premium subsidies farmers can receive.
The 2023 Farm Bill provides a key opportunity to make these and other changes so that the Crop Insurance Program works better for farmers, taxpayers and the environment.