Jump to:
Jump to:
Overview
- Crop insurance payouts were over $118.7 billion between 2001 and 2022 for the top five weather-related losses.
- The extreme weather triggering these payments is becoming more frequent as climate change accelerates.
- A new EWG map shows hot spots where most of the money has gone.
Crop insurance payouts for losses associated with extreme weather have cost billions of dollars, a new Environmental Working Group analysis of Department of Agriculture data shows. Indemnities for the five most expensive weather-related causes of loss – drought, excess moisture and precipitation, hail, heat and freeze – totaled over $118.75 billion between 2001 and 2022, representing 73 percent of total crop insurance payouts.
The extreme weather events that triggered these payments are closely associated with the climate emergency. Yet the Crop Insurance Program does not encourage farmers to adapt to the extreme weather linked to the climate crisis, as EWG recently explained.
Our new investigation found that weather-related crop insurance indemnities have steeply risen over the past 22 years. As climate change continues to accelerate, it seems inevitable that, without meaningful reform, crop insurance costs will likewise grow unsustainably.
Along with the analysis, we’ve also created an interactive map to show the “hot spots” for climate-related crop insurance payments – regions where these losses have been especially expensive.
For instance, the map shows that almost three-fourths of all crop insurance payments for drought – over $41 billion – went to states in the Great Plains and the Midwest.
Weather-related losses have dramatically increased
Analyzing USDA data in EWG’s newly updated Crop Insurance Database, we found that payments to farmers from the federal Crop Insurance Program have increased dramatically over time for the top five weather-related causes of loss.
Indemnities in each category more than doubled between 2001 and 2022, with payments for heat increasing the most – over 1,000 percent, or more than 10 times.
Comparing indemnity payments for each cause of loss in 2022 to those in 2001, when current subsidy levels were set:
- Drought went up 690 percent, from $965.5 million in 2001 to $7.6 billion in 2022.
- Excess moisture went up 123 percent, from $1 billion to $2.2 billion.
- Hail went up 204 percent, from $228.3 million to $692.9 million.
- Heat had the largest increase at 1,012 percent, from $142.5 million to $1.6 billion.
- Payments for freeze increased 771 percent, from $78.6 million to $683.9 million.
While some of these increases can be attributed to expanded farmer participation and rising crop prices, extreme weather linked to climate change is a very important driver.
EWG’s investigation is separate from, but similar to our finding in an earlier report that total payments from the crop insurance program, across all causes of loss, increased by well over 500 percent between 2001 and 2022.
Heat by far showed the largest increase in indemnities paid out. Rapidly rising temperatures from the climate crisis have already damaged agriculture and spiked the cost of the Crop Insurance Program, and this trend is widely expected to continue.
Heat is wreaking havoc on agriculture, infrastructure and public health throughout the country, and has been especially damaging in the Southwest and southern Great Plains states.
Five weather-related causes of loss triggered nearly three-fourths of all indemnities
Nationally, between 2001 and 2022, the federal Crop Insurance Program sent farmers over $161.6 billion in payments for all causes of loss.
Four of the most expensive five causes of loss were related to weather: drought (first), excess moisture and precipitation (second), hail (fourth) and heat (fifth).
(The cause of loss with the third-highest amount of payments is a catch-all category that includes a number of different policies without specifically mentioned causes of loss. See the Methodology and the Risk Management Agency’s website for more information on these policies.)
The sixth most costly cause of loss was decline in crop price, while freeze was seventh.
The five most expensive weather-related causes of loss in rank order were drought, excess moisture and precipitation, hail, heat and freeze. Collectively, they generated $118.75 billion in payments – 73 percent of the total (Table 1).
The two most expensive causes of loss, drought and excess moisture, were together responsible for $96.37 billion in indemnities – almost 60 percent of all payouts.
The Fourth National Climate Assessment predicts that extreme weather conditions like these are likely to continue to worsen in the future, causing even more damage to U.S. agriculture.
Table 1. The five weather-related causes of loss with the most indemnities generated $118.75 billion in payments between 2001 and 2022.
| Top five weather-related causes of loss | Total payments 2001-2022 |
|---|---|
| Drought | $56,584,134,961 |
| Excess moisture, precipitation, rain | $39,781,655,988 |
| Hail | $9,656,080,462 |
| Heat | $7,984,953,662 |
| Freeze | $4,744,033,806 |
| Total | $118,750,858,878 |
Source: EWG, from USDA Risk Management Agency, Cause of Loss Historical Data Files
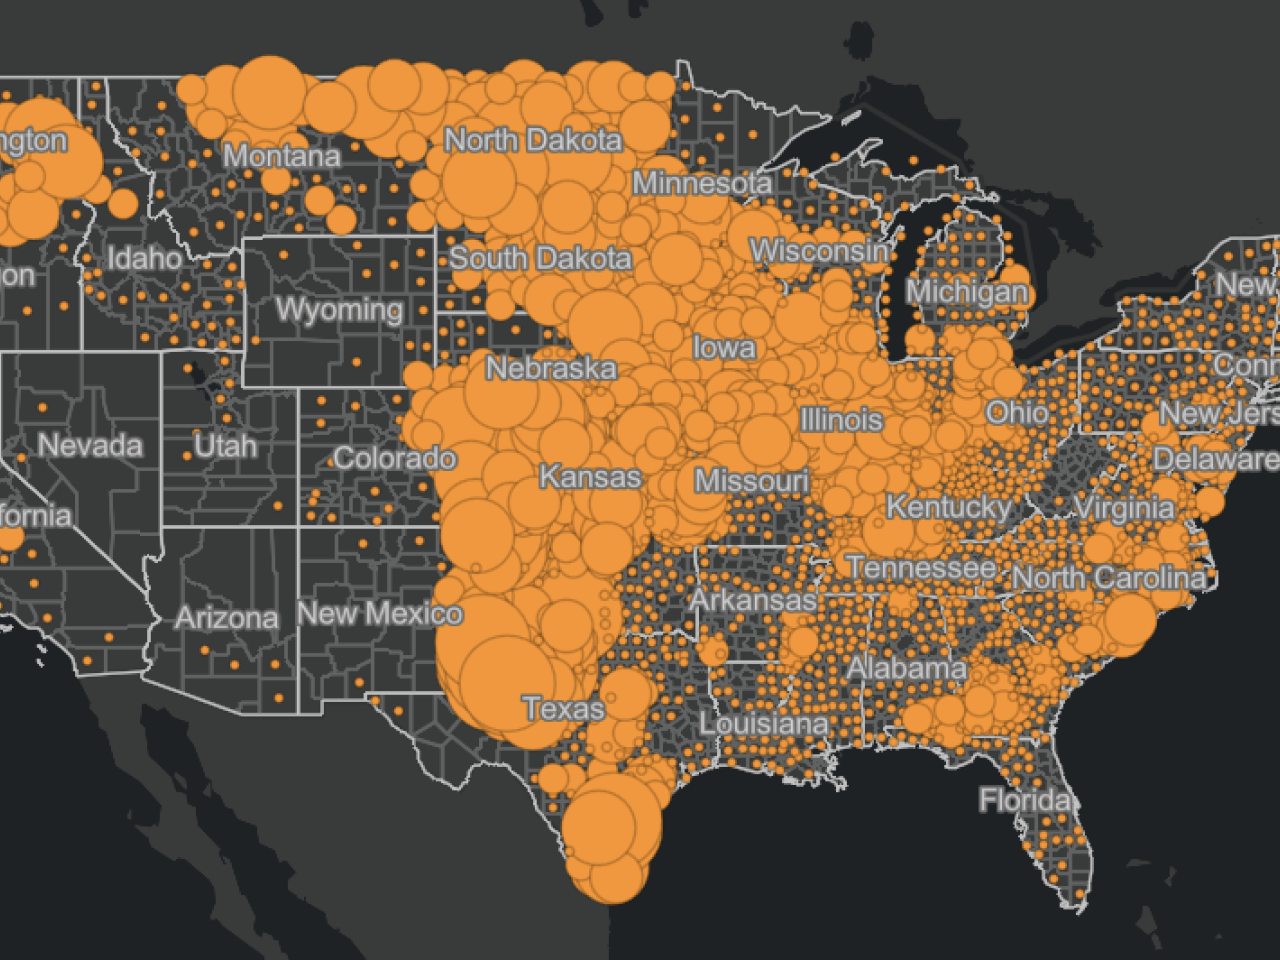
New map shows hot spots where climate-linked payments are concentrated
EWG used USDA data from our Crop Insurance Database to make an interactive map with county-level crop insurance payments for the five most expensive weather-related causes of loss across the U.S.
This map shows the regions that received most of the money paid out for drought, excess moisture, hail, heat and freeze.
These hot spots are also where indemnities are likely to get even more expensive in the future, as the climate crisis intensifies and weather conditions become more volatile. Farms in these areas disproportionately generate crop insurance payouts – and thus taxpayer costs – for the causes of loss most tied to climate change. Accordingly, they are potentially more vulnerable to the climate crisis.
These maps show county-level crop insurance payments for the five weather-related causes of loss with the most payments between 2001 and 2022. The weather-related causes of loss with the most payments over this timeframe in rank order of most payments were: drought, excess moisture, hail, heat and freeze.
Drought
Drought was the most expensive cause of loss nationally at $56.6 billion, making up 35 percent of all crop insurance payouts made between 2001 and 2022. Perhaps surprisingly, most crop insurance payments for drought were paid to farmers in the Great Plains and Midwest.
Farmers in 10 states received $41.8 billion, or 74 percent of all drought payments. In the Great Plains, these states were – in order of most money paid out to least – Texas, Kansas, South Dakota, North Dakota, Nebraska and Oklahoma. In the Midwest, in rank order, they were Iowa, Illinois, Missouri and Minnesota (Table 2).
Table 2. Farmers in Great Plains and Midwest states got the majority of drought payments.
| State | Drought payments 2001-2022 | Rank |
|---|---|---|
| Texas | $9,965,857,966 | 1 |
| Kansas | $6,528,541,596 | 2 |
| South Dakota | $4,107,298,847 | 3 |
| Iowa | $4,018,399,221 | 4 |
| Illinois | $3,799,720,456 | 5 |
| North Dakota | $3,615,273,772 | 6 |
| Nebraska | $3,393,699,605 | 7 |
| Missouri | $2,173,970,152 | 8 |
| Oklahoma | $2,134,412,930 | 9 |
| Minnesota | $2,038,478,509 | 10 |
| Total | $41,775,653,054 |
Source: EWG, from USDA Risk Management Agency, Cause of Loss Historical Data Files
Farmers in Texas received, by far, the most money in drought payments: almost $10 billion, or 18 percent of all drought payments made nationwide. Eight of the 10 counties that received the largest amounts in drought payments were in Texas.
Nationally, growers of corn received the most drought indemnities out of all crops, almost $22.6 billion. Wheat growers got the second-most at $10 billion.
Drought will likely continue to worsen in the Great Plains, especially in Kansas, Oklahoma and Texas. The Fourth National Climate Assessment predicts that these three states will increasingly experience extreme heat, with a higher likelihood of drier summers – the season when precipitation is especially important for agriculture.
In the Midwest, climate predictions show longer-term increasing precipitation trends, but with short-term periods of extreme drought, indicating a high potential for swings from drought to floods.
Excess moisture and precipitation
Excess moisture and precipitation was the cause of loss that triggered the second largest payouts nationally at $39.8 billion, accounting for 25 percent of all national crop insurance payouts between 2001 and 2022.
Payments for excess moisture were especially concentrated in the Northern Great Plains states of North Dakota and South Dakota and in the Midwest. There were also several counties along the southern Mississippi River and in California’s Central Valley that received large amounts in excess moisture payments.
The six states that received the most payments, in rank order, were North Dakota, Minnesota, South Dakota, Iowa, Illinois and Missouri. Farmers in these six states got $20.9 billion in excess moisture payments, which made up over half of all such payments nationally (Table 3).
Table 3. Excess moisture payments were concentrated in North and South Dakota and in the Midwest.
| State | Excess moisture payments 2001-2022 | Rank |
|---|---|---|
| North Dakota | $6,758,643,193 | 1 |
| Minnesota | $3,452,736,052 | 2 |
| South Dakota | $3,326,898,263 | 3 |
| Iowa | $2,623,075,169 | 4 |
| Illinois | $2,503,058,060 | 5 |
| Missouri | $2,244,709,606 | 6 |
| Total | $20,909,120,343 |
Source: EWG, from USDA Risk Management Agency, Cause of Loss Historical Data Files
The three states with the most payments in rank order – North Dakota, Minnesota and South Dakota – are in the Prairie Pothole Region. In this area, many farms are on or include seasonal wetlands that are wet for much of the year. Because of the saturated landscape, excess moisture crop insurance payouts are especially expensive in these states.
Brown County, S.D., received more money in excess moisture payments than any other county in the U.S. The rest of the top 10 excess moisture counties were in North Dakota.
Nationally, corn farmers received the most money in excess moisture indemnities out of all crops – $15.7 billion – with soybean farmers next at $8.4 billion.
As EWG described in a 2022 report, precipitation and crop insurance indemnities for excess moisture have already increased over time in the majority of counties in the Midwest and in North and South Dakota. Thanks to changes in weather associated with the climate crisis – namely storms that are both more frequent and more severe – excess moisture insurance payments will likely continue to rise.
Hail, heat and freeze
Hail, heat and freeze generated the third, fourth and fifth most payments out of all weather-related causes of loss. These causes of loss cost less than drought or excess moisture, but still made up a sizable amount, together sending out $22.4 billion between 2001 and 2022 – 14 percent of total national indemnities.
Hail payments were made largely in the Great Plains and Montana, with additional, smaller concentrations in Iowa and Minnesota.
Farmers in the seven states that received the most money in hail payments – in order, Texas, Nebraska, North Dakota, Kansas, Colorado, South Dakota, and Montana – got $7.4 billion, or 76 percent of all hail indemnities. Farmers of corn and wheat received the most hail payments out of all crops: corn growers got $2.5 billion and wheat growers, $2.2 billion.
Heat and freeze are more or less opposite weather conditions, but payments for both were concentrated in the same hot spot. For both heat and freeze, California, Texas, Kansas and Washington were among the five states with the most indemnities (Table 4).
Rounding out the top five were Nebraska with the fourth most heat payments, and Oklahoma, with the fourth most freeze payments. (They are not shown in the table.)
Table 4. Farmers in California, Texas, Kansas and Washington received large payments for both heat and freeze.
| State | Heat payments 2001-2022 | Heat payment state rank | Freeze payments 2001-2022 | Freeze payment state rank |
|---|---|---|---|---|
| California | $1,332,523,580 | 1 | $747,624,342 | 1 |
| Texas | $1,129,746,989 | 2 | $665,797,862 | 2 |
| Kansas | $1,019,116,710 | 3 | $511,526,361 | 3 |
| Washington | $351,705,257 | 5 | $298,811,026 | 5 |
| Total | $3,833,092,535 | $2,223,759,591 |
Source: EWG, from USDA Risk Management Agency, Cause of Loss Historical Data Files
Farmers in California, Texas, Kansas and Washington got almost half of all heat payments, amounting to $3.8 billion of the almost $8 billion of heat indemnities nationally.
In California, the state with the highest total amount paid out for heat-related losses, the total amount sent to farmers grew 1,760 percent, from just $11.7 million in 2001 to $217.3 million in 2022. Farmers of pistachios, grapes and prunes received the most heat payments in California.
For freeze, farmers in California, Texas, Kansas and Washington also got almost half of all freeze payments: $2.2 billion, or 47 percent of freeze payments across the U.S. totaling $4.7 billion.
Nationally, corn farmers received the most heat payments, while wheat farmers got the most freeze payments. After wheat, apples and almonds were two of the other crops that were most damaged by freeze. Freeze more commonly hurts specialty crops like fruits, vegetables and nuts than the other top weather-related causes of loss.
Program reform is needed to encourage climate change adaptation
The federal Crop Insurance Program has paid out an increasing amount of money to farmers for the top weather-related causes of loss. Since the program does not currently encourage farmers to adapt to climate change, without reforms, payouts and program costs will continue to get bigger for these causes of loss both nationally and in the hot spots we’ve identified.
Although some crop insurance reforms can be undertaken at any time by the USDA, the 2023 Farm Bill provides an opportunity for lawmakers to make American agriculture more resilient in the face of climate crisis-linked extreme weather and to reduce taxpayers’ increasing costs.
Multiple reforms could be made to accomplish both goals, including:
- Overhaul how premiums are calculated to better reflect extreme weather.
- Lower premium subsidies on high-risk lands most vulnerable to climate change.
- Change the subsidy structure and paperwork requirements to encourage more Whole Farm Revenue Protection policies, which can help promote crop diversification.
- Establish payment limits and income limit means tests on premium subsidies to send more payments to small farms that need them most.
- Make crop insurance subsidies more transparent.
The Crop Insurance Program must be reformed so it works better for farmers, taxpayers and the environment.