America has a serious problem with nitrate contamination of drinking water – and it is most severe in the small communities that can least afford to fix it.
Nitrate, primarily from polluted farm runoff, contaminates the public water supplies of almost 1,700 communities nationwide at levels the National Cancer Institute says could increase the risk of cancer.
Federal data show that about two-thirds of those – 1,155 systems serving more than 3 million people – have no treatment systems to lower nitrate concentrations to safer levels. Of the systems without nitrate treatment, more than six out of 10 serve 500 or fewer people, and nearly nine out of 10 serve fewer than 3,300 people.
Removing nitrate from tap water is expensive. A city can spread the cost of treatment over a larger customer base. But in small communities, depending on the technology used, the increased cost of treatment per person could be hundreds or thousands of dollars a year.
It’s much cheaper to keep nitrate out of drinking water in the first place than to remove it. But so-called volunteer approaches, like making tax-funded payments to farmers who change where and how they farm, have not worked. Without aggressive, targeted and enforceable protection efforts, America’s nitrate problem will get worse, and more Americans will be at risk of drinking contaminated water.
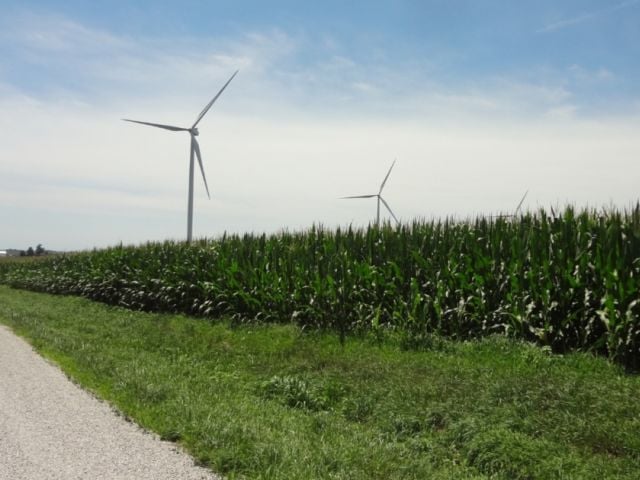
Nitrogen boosts crop yields, but pollutes water
Nitrate pollution comes from a variety of sources, but agriculture is by far the biggest contributor to the problem.
Millions of tons of commercial fertilizer and manure are applied on cropland across the U.S. every year. The nitrogen in fertilizer and manure boosts crop yields. But when it runs off as nitrate, it can pollute both surface water and groundwater, and its harmful impacts are felt far beyond the fields where it is applied.1
Under the federal Safe Drinking Water Act , the legal limit for nitrate in drinking water is 10 parts per million, or ppm. This limit was set in 1962 to guard against blue baby syndrome, a potentially fatal condition that starves infants of oxygen if they ingest too much nitrate.2
But newer studies from the National Cancer Institute have found that drinking water containing 5 ppm of nitrate – half the legal limit – increases the risk of colon, kidney, ovarian and bladder cancers.3 Other research shows more frequent birth defects in babies whose mothers consumed 5 ppm of nitrate daily from drinking water during pregnancy.4
According to data from the Environmental Protection Agency for 2014 and 2015, at least 1,155 communities with average nitrate levels at or above 5 ppm had no treatment system in place to reduce nitrate to safer levels.5
Though water systems lacking nitrate treatment are clustered in farming areas of the Midwest and California, they are found in a total of 43 states. The EPA classifies more than 60 percent of the water systems as “very small,” serving 500 or fewer residents. Another one-fourth are classified as “small,” serving between 501 and 3,300 people.
Treatment options are expensive
To remove nitrate from drinking water, the EPA recommends either an ion exchange or reverse osmosis treatment system.
Ion exchange systems contain a resin that removes nitrate as water passes through it. In reverse osmosis systems, pressurized water is pushed through a membrane that filters out nitrate and other contaminants. For both systems, the higher the concentration of nitrate, the higher the cost of removing it. Communities usually only use reverse osmosis if they need to remove other contaminants in addition to nitrate.
Treatment costs depend on the size of the system, the concentration of nitrate in the water and the concentration goal for the treatment. These variables make it harder to determine the treatment cost a given community may face. For example:
- In October of 2017, Hiawatha, Kan., began building a new water treatment plant that included an ion exchange system. Nitrate levels in Hiawatha had hit 11 ppm a few months before – it was one of several times the town has warned residents not to drink tap water.6 The plant will cost the town of about 3,300 an estimated $3.5 million.
- In Chino, Calif., nitrate levels ranged from 9 ppm to 45 ppm before 2005. That year, the city, whose population then was about 75,000, built an ion exchange system at a cost of $4.6 million.7
A direct comparison can’t be made because population is not the same as the number of water customers, and contamination levels were different. But it’s clear that Chino, the larger system, had a much lower cost per person than Hiawatha.
Researchers at the University of California at Davis came up with a method to make an informed estimate of the range of nitrate treatment costs per 1,000 gallons of water treated.8
From there, EWG calculated that the cost of building and maintaining an ion exchange treatment system could add as much as $666 a year per person to the cost of providing drinking water in a very small community. A reverse osmosis system could add as much as $2,776 a year. (See the Appendix for details of the UC Davis researchers’ and EWG’s calculations.)
Water bills are normally calculated per household, not per person. Lacking data on the number of households per community, EWG used per person costs as an indicator of the burden the added cost of treatment could impose on communities.
Based on the UC Davis researchers’ base estimates and EWG’s analysis, the map below shows high-end cost estimates for each person in almost all communities that have nitrate contamination above 5 ppm, but that lack nitrate treatment systems. Costs could not be calculated for two water systems classified as “very large,” with 100,000 or more residents. Click on a location to see the cost per person to install and operate an ion exchange system.
Figure 1. Nitrate contamination of tap water is found mostly in small or very small communities.
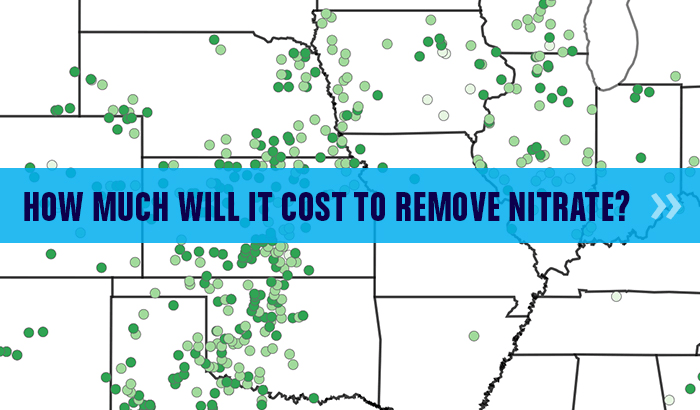
Source: EWG, from Environmental Protection Agency, SDWIS Data, and University of California, Davis, Technical Report 6: Drinking Water Treatment for Nitrate
The table below shows that the additional cost per person for an ion exchange system ranges widely. The low-end estimates range from $28 per person per year for the largest communities, to $90 per person per year for the smallest communities. High-end estimates range from $229 per person per year for large communities to $666 per person per year for very small communities.
Table 1: Cost per person per year to build and operate an ion exchange treatment system.
|
Community Size |
Ion Exchange |
|
|
Low Cost |
High Cost |
|
|
Very Small (<501) |
$90 |
$666 |
|
Small (501-3,300) |
$47 |
$378 |
|
Medium (3,301-10,000) |
$48 |
$273 |
|
Large (10,001-100,000) |
$28 |
$229 |
Source: EWG, from Environmental Protection Agency, SDWIS Data, and University of California, Davis, Technical Report 6: Drinking Water Treatment for Nitrate
If all U.S. communities with nitrate concentrations at or above 5 ppm in 2014 and 2015, but that lacked nitrate treatment, added ion exchange systems, the total extra cost would range from about $102 million a year to almost $765 million a year. If each of these communities without nitrate treatment chose to add a reverse osmosis system instead, the added cost could be as high as $1.47 billion a year.
Given the expense of a treatment system, some communities have tried other ways to reduce nitrate contamination: blending contaminated water with cleaner water, shutting off wells with seasonally high nitrate levels, digging new or deeper wells, or connecting to another water system that doesn’t have a nitrate problem.
But those options are still expensive. To dig and operate a new well, or deepen an old well, a small water system could pay $46,000 to $330,000 a year.9
Where the problem is worst
Nitrate contaminates drinking water throughout the nation, but is highly concentrated in a few counties within a few states.
Of the communities with 5 ppm or more of nitrate but no treatment system, almost half are in just five states: California, Texas, Kansas, Pennsylvania and Oklahoma. Adding another five states – Washington, Arizona, Illinois, Nebraska and New York – covers almost 70 percent of such communities.
In 2014 and 2015, California had 142 communities with nitrate levels at or above 5 ppm, but with no nitrate treatment – the most in the nation. More than 40 percent of those communities were in Los Angeles, Kern and Tulare counties. In each of those counties, in 2016, the poverty rate was above the state average and household income levels were below the state average.
According to the UC Davis Center for Watershed Sciences, about 220,000 Californians in the Tulare Lake Basin and Salinas Valley get their drinking water from small water systems that are chronically plagued by nitrate contamination.10 The estimated cost of long-term solutions to the state’s nitrate problem in these areas is $34 million a year, which would add almost $150 per person to the yearly cost of drinking water for some of the poorest people in California.
The pattern of concentrated contamination in a few lower-income counties was similar or even worse in other top states. For example, in Arizona, 79 percent of the communities without nitrate treatment were in three counties, and in Pennsylvania, three counties had almost half the untreated communities. Looking at the top three counties for nitrate contamination in each of the top states, more than two-thirds had household income levels below the state average.
Private wells aren’t covered by legal limits
Private wells don’t have to comply with the 10 ppm legal limit for nitrate. More than 43 million Americans get their drinking water from private wells.11 A 2009 study from the U.S. Geological Survey found that 4 percent of all private wells have nitrate levels greater than the legal limit,12 but the problem is much worse in farming areas.
Coates, Minn., is home to about 160 people. More than half of the land in surrounding Dakota County is used to grow corn and soybeans. Minnesota Department of Agriculture data show that more than half of the private wells serving Coates may have nitrate levels above the federal legal limit.13
The national number of private wells with nitrate levels above the lower cancer threshold is unknown, but would be much higher. An estimated 17 percent of the groundwater area in Nebraska, and 10 percent of that in California, is contaminated with nitrate above 5 ppm.14
Voluntary programs not enough
Keeping nitrate out of drinking water is much cheaper than removing it through treatment. Water treatment costs in communities with elevated nitrate concentrations are four to five times higher than those in areas without a problem.15
But except for the largest livestock operations, agriculture is largely exempt from federal Clean Water Act standards. Efforts to reduce polluted farm runoff have relied almost exclusively on so-called voluntary programs, which pay farmers to take steps to prevent pollution.
This approach has inherent weaknesses. The biggest flaw: Landowners who voluntarily start pollution-prevention practices can also stop them.
In the 1990s, Edgerton, Minn., with a population of fewer than 1,200, built a treatment plant to deal with rising nitrate levels, at a cost of about $3,500 per resident.16 The city also created a voluntary plan to help farmers manage fertilizer and retire cropland. Nitrate levels in the water supply dropped by half and treatment costs were lowered.17 But when crop prices jumped in 2005, farmers again planted crops on land that had been set aside. Nitrate levels increased and so did the cost of treatment.
Most voluntary conservation efforts do not actually help clean up drinking water. The Department of Agriculture spends billions of dollars a year on programs to encourage farmers to use conservation practices. Yet EWG’s research reveals a stunning underinvestment in the practices needed to protect drinking water in the places where it is most threatened.
For example, the Conservation Stewardship Program and the Environmental Quality Incentives Program pay farmers to plant cover crops, a key practice for preventing contamination of groundwater with nitrate. But almost 40 percent of the communities contaminated with nitrate at levels above 5 ppm are in counties where no farmers receive cover crop payments through those programs.
Clearly, there is a huge opportunity to focus these federal programs more tightly to head off the financial crisis rural communities may face to clean their drinking water.
Still, voluntary practices simply aren’t a long-term solution. As conservation practices come and go, taxpayer dollars spent to encourage farmers to implement pollution-prevention practices often fail to achieve lasting progress. In the counties of the communities on our map, almost $30 million was spent in 2015 through the Environmental Quality Incentives Program to encourage better practices, yet serious nitrate pollution remains.18
The voluntary approach must be buttressed by setting mandated basic farm standards that target the most damaging practices. The standards should be tailored to different landscapes, watersheds and farming systems – but they must be required.
Voluntary programs could supplement these basic standards, to target the most effective pollution-prevention practices in the right places on the right farms. Voluntary programs are far more effective if practices are targeted to high-pollution areas.19 New watershed-level tools like the Department of Agriculture’s Agricultural Conservation Planning Framework use data to pinpoint locations where conservation practices will do the most good.20
There is still time to spare some communities with elevated levels of nitrate from facing the cost of building a treatment plant. Almost three-fourths of the communities without nitrate treatment on our map had average nitrate levels between 5 ppm and 7.5 ppm. Acting now to implement effective farm conservation practices could head off the need for huge capital expenditures down the line.
Combining common-sense standards with the investment of tax dollars to encourage additional steps is a better path to clean drinking water than putting the entire burden on drinking water utilities that serve small communities with limited resources.
----
APPENDIX (make drop-down)
University of California at Davis researchers estimated total annualized costs for a water system to use ion exchange for nitrate removal based on system size. Economists often use annualized costs to value the cost of long-term building projects. For water treatment, the annualized cost of an ion exchange process is what a system would have to pay each year to pay off the loan on the capital building project, as well as the cost to operate and maintain the treatment process, over 20 years.
UC Davis researchers’ cost estimates include both capital costs and operating and maintenance costs. The researchers provided low and high cost estimates for each system size, from very small systems to large systems. These estimates were in dollars per 1,000 gallons treated. The cost estimate ranges were large because water treatment costs vary greatly from system to system. When nitrate concentrations increase, costs to remove them often also go up.
To calculate what it would cost annually for the 1,153 communities without nitrate treatment to build and maintain an ion exchange or reverse osmosis system, EWG multiplied the amount of water to be treated each year by the UC Davis cost estimates for the size of the system. Nitrate usually only contaminates drinking water at certain times of the year, and not every day throughout the year. However, exactly how much water each system would need to treat for nitrate each year cannot be predicted, and changes from year to year. So, EWG calculated the cost of removing nitrate from the total amount of water produced in a year. We then divided these costs by the population the water system serves to determine the annual cost per person. Inflation was taken into account in determining the cost of nitrate treatment.
---
References
- EWG, Interactive Graphic: Farm Pollution from Field to Tap. August 2017. Available at www.ewg.org/tapwater/troubled-water.php#.WyA-9KczqUk
- EWG, Nitrate. EWG’s Tap Water Database, July 2017. Available at www.ewg.org/tapwater/reviewed-nitrate.php#.WsJdr4hzaUk
- The National Cancer Institute, Nitrate. February 2018. Available at progressreport.cancer.gov/prevention/nitrate
- Jean D. Brender et al., Prenatal Nitrate Intake from Drinking Water and Selected Birth Defects in Offspring of Participants in the National Birth Defects Prevention Study. Environmental Health Perspectives, September 2013. Available at ehp.niehs.nih.gov/1206249/
- Environmental Protection Agency, SDWIS Model. Envirofacts. Available at www.epa.gov/enviro/sdwis-model
- City of Hiawatha Issues High Nitrate Warning. Hiawatha World, July 11, 2017. Available at www.hiawathaworldonline.com/news/city-of-hiawatha-issues-high-nitrate-warning/article_71208a3a-b98e-54a4-bc20-1c4b9bdd7a10.html
- Vivian B. Jensen et al., Technical Report 6: Drinking Water Treatment for Nitrate. Center for Watershed Sciences, University of California, Davis, July 2012. Available at groundwaternitrate.ucdavis.edu/files/139107.pdf
- Ibid.
- Kristin Honeycutt et al., Technical Report 7: Alternative Water Supply Options for Nitrate Contamination. Center for Watershed Sciences, University of California, Davis, July 2012. Available at groundwaternitrate.ucdavis.edu/files/139108.pdf
- University of California Davis Center for Watershed Sciences, Addressing Nitrate in California’s Drinking Water. Available at watermanagement.ucdavis.edu/files/2214/5886/6964/Harter_et_al._2012_Addressing_Nitrate_in_CA_Drinking_Water.pdf
- Leslie A. DeSimone et al., Quality of Water from Domestic Wells in Principal Aquifers of the United States, 1991–2004. United States Geological Survey, March 2009. Available at pubs.usgs.gov/circ/circ1332/
- Ibid.
- Erin Adler, Tiny Dakota County Town Has a Big Problem: Polluted Water. Star Tribune, July 28, 2018. Available at www.startribune.com/tiny-coates-has-a-big-problem-polluted-water/489428861/
- Environmental Protection Agency, Estimated Nitrate Concentrations in Groundwater Used for Drinking. Available at www.epa.gov/nutrient-policy-data/estimated-nitrate-concentrations-groundwater-used-drinking
- Minnesota Department of Health and Minnesota Department of Agriculture, Nitrate Contamination- What is the Cost? 2004. Available at http://www.nesc.wvu.edu/ecommerce/products/DW_PublicEducation/DWFSPE347DL.pdf
- Minnesota Drinking Water Annual Report for 2016.
- Minnesota Drinking Water Annual Report for 2014.
- EWG, Environmental Quality Incentives Program (EQIP) in the United States. EWG’s Conservation Database. Available at conservation.ewg.org/eqip.php?fips=00000®ionname=theUnitedStates
- Iowa Department of Agriculture and Land Stewardship, Iowa Department of Natural Resources and Iowa State University College of Agriculture and Life Sciences, Iowa Nutrient Reduction Strategy: A Science and Technology-Based Framework to Assess and Reduce Nutrients to Iowa Waters and the Gulf of Mexico. Updated December 2017. Available at www.nutrientstrategy.iastate.edu/documents
- North Central Region Water Network, The Agricultural Conservation Planning Framework (ACPF): A Watershed Planning Tool. United States Department of Agriculture, 2018. Available at northcentralwater.org/acpf/